United Healthcare 2014 Annual Report Download - page 57
Download and view the complete annual report
Please find page 57 of the 2014 United Healthcare annual report below. You can navigate through the pages in the report by either clicking on the pages listed below, or by using the keyword search tool below to find specific information within the annual report.-
 1
1 -
2
-
3
-
4
-
5
-
6
-
7
-
8
-
9
-
10
-
11
-
12
-
13
-
14
-
15
-
16
-
17
-
18
-
19
-
20
-
21
-
22
-
23
-
24
-
25
-
26
-
27
-
28
-
29
-
30
-
31
-
32
-
33
-
34
-
35
-
36
-
37
-
38
-
39
-
40
-
41
-
42
-
43
-
44
-
45
-
46
-
 47
47 -
 48
48 -
 49
49 -
 50
50 -
 51
51 -
 52
52 -
 53
53 -
 54
54 -
 55
55 -
 56
56 -
 57
57 -
 58
58 -
 59
59 -
 60
60 -
 61
61 -
 62
62 -
 63
63 -
 64
64 -
 65
65 -
 66
66 -
 67
67 -
68
-
69
-
70
-
71
-
72
-
73
-
74
-
75
-
76
-
77
-
78
-
79
-
80
-
81
-
82
-
83
-
84
-
85
-
86
-
87
-
88
-
89
-
90
-
91
-
92
-
93
-
94
-
95
-
96
-
97
-
98
-
99
-
100
-
101
-
102
-
103
-
104
-
105
-
106
-
107
-
108
-
109
-
110
-
111
-
112
-
113
-
114
-
115
-
116
-
117
-
118
-
119
-
120
 |
 |
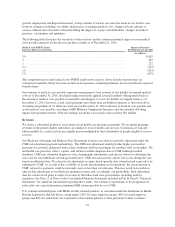
conclude otherwise, we would perform a quantitative analysis by comparing its estimated fair value to its
carrying value. If the carrying value exceeds its estimated fair value, an impairment would be recorded for the
amount by which the carrying value exceeds its estimated fair value. Intangible assets were not materially
impaired in 2014.
Investments
As of December 31, 2014, we had investments with a carrying value of $20.6 billion, primarily held in
marketable debt securities. Our investments are principally classified as available-for-sale and are recorded at fair
value. We exclude gross unrealized gains and losses on available-for-sale investments from net earnings and
report net unrealized gains or losses, net of income tax effects, as other comprehensive income and as a separate
component in shareholders’ equity. We continually monitor the difference between the cost and fair value of our
investments. As of December 31, 2014, our available-for-sale investments had gross unrealized gains of $423
million and gross unrealized losses of $66 million.
For debt securities, if we intend to either sell or determine that we will be more likely than not be required to sell
the security before recovery of the entire amortized cost basis or maturity of the security, we recognize the entire
impairment in earnings. If we do not intend to sell the debt security and we determine that we will not be more
likely than not be required to sell the debt security but we do not expect to recover the entire amortized cost
basis, the impairment is bifurcated into the amount attributed to the credit loss, and recognized in net earnings,
and all other causes, and recognized in other comprehensive income.
For equity securities, we recognize unrealized losses in other comprehensive income if we expect to hold the
equity security until fair value increases to at least the equity security’s cost basis and we expect that increase in
fair value to occur in a reasonably forecasted period. If we intend to sell the equity security or if we believe that
recovery of fair value to cost will not occur in the near term, we recognize the loss in net earnings.
The most significant judgments and estimates related to investments are related to determination of their fair
values and the other-than-temporary impairment assessment.
Fair Values. Fair values of available-for-sale debt and equity securities are based on quoted market prices, where
available. We obtain one price for each security primarily from a third-party pricing service (pricing service),
which generally uses quoted or other observable inputs for the determination of fair value. The pricing service
normally derives the security prices through recently reported trades for identical or similar securities, making
adjustments through the reporting date based upon available observable market information. For securities not
actively traded, the pricing service may use quoted market prices of comparable instruments or discounted cash
flow analyses, incorporating inputs that are currently observable in the markets for similar securities. Inputs that
are often used in the valuation methodologies include, but are not limited to, benchmark yields, credit spreads,
default rates and prepayment speeds, and non-binding broker quotes. As we are responsible for the determination
of fair value, we perform quarterly analyses of the prices received from the pricing service to determine whether
the prices are reasonable estimates of fair value. Specifically, we compare:
• prices received from the pricing service to prices reported by a secondary pricing service, our custodian, our
investment consultant and third-party investment advisors; and
• changes in the reported market values and returns to relevant market indices and our expectations to test the
reasonableness of the reported prices.
Based on our internal price verification procedures and our review of the fair value methodology documentation
provided by independent pricing service, we have not historically adjusted the prices obtained from the pricing
service.
Other-Than-Temporary Impairment Assessment. Individual securities with fair values lower than costs are
reviewed for impairment considering the following factors: our intent to sell the security or the likelihood that we
will be required to sell the security before recovery of the entire amortized cost, the length of time and extent of
55