United Healthcare 2014 Annual Report Download - page 68
Download and view the complete annual report
Please find page 68 of the 2014 United Healthcare annual report below. You can navigate through the pages in the report by either clicking on the pages listed below, or by using the keyword search tool below to find specific information within the annual report.-
 1
1 -
2
-
3
-
4
-
5
-
6
-
7
-
8
-
9
-
10
-
11
-
12
-
13
-
14
-
15
-
16
-
17
-
18
-
19
-
20
-
21
-
22
-
23
-
24
-
25
-
26
-
27
-
28
-
29
-
30
-
31
-
32
-
33
-
34
-
35
-
36
-
37
-
38
-
39
-
40
-
41
-
42
-
43
-
44
-
45
-
46
-
47
-
48
-
49
-
50
-
51
-
52
-
53
-
54
-
55
-
56
-
57
-
 58
58 -
 59
59 -
 60
60 -
 61
61 -
 62
62 -
 63
63 -
 64
64 -
 65
65 -
 66
66 -
 67
67 -
 68
68 -
 69
69 -
 70
70 -
 71
71 -
 72
72 -
 73
73 -
 74
74 -
 75
75 -
 76
76 -
 77
77 -
 78
78 -
79
-
80
-
81
-
82
-
83
-
84
-
85
-
86
-
87
-
88
-
89
-
90
-
91
-
92
-
93
-
94
-
95
-
96
-
97
-
98
-
99
-
100
-
101
-
102
-
103
-
104
-
105
-
106
-
107
-
108
-
109
-
110
-
111
-
112
-
113
-
114
-
115
-
116
-
117
-
118
-
119
-
120
 |
 |

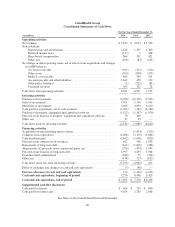
UnitedHealth Group
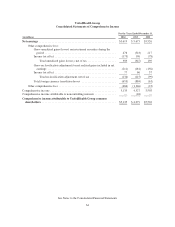
Consolidated Statements of Cash Flows
For the Years Ended December 31,
(in millions) 2014 2013 2012
Operating activities
Net earnings ....................................................... $5,619 $ 5,673 $ 5,526
Noncash items:
Depreciation and amortization .................................... 1,478 1,375 1,309
Deferred income taxes ........................................... (117) 1 308
Share-based compensation ....................................... 364 331 421
Other, net ..................................................... (298) (83) (231)
Net change in other operating items, net of effects from acquisitions and changes
in AARP balances:
Accounts receivable ............................................ (911) (317) (130)
Other assets ................................................... (590) (838) (295)
Medical costs payable ........................................... 484 509 101
Accounts payable and other liabilities .............................. 1,642 459 199
Other policy liabilities ........................................... (5) (221) (81)
Unearned revenues ............................................. 385 102 28
Cash flows from operating activities .................................... 8,051 6,991 7,155
Investing activities
Purchases of investments ............................................ (9,928) (12,176) (9,903)
Sales of investments ................................................ 7,701 5,706 3,794
Maturities of investments ............................................ 3,026 4,859 4,810
Cash paid for acquisitions, net of cash assumed ........................... (1,923) (362) (6,280)
Purchases of property, equipment and capitalized software .................. (1,525) (1,307) (1,070)
Proceeds from disposal of property, equipment and capitalized software ....... 78 146 —
Other, net ......................................................... 37 45 —
Cash flows used for investing activities ................................. (2,534) (3,089) (8,649)
Financing activities
Acquisition of noncontrolling interest shares ............................. — (1,474) (319)
Common stock repurchases ........................................... (4,008) (3,170) (3,084)
Cash dividends paid ................................................ (1,362) (1,056) (820)
Proceeds from common stock issuances ................................. 462 598 1,078
Repayments of long-term debt ........................................ (812) (1,609) (986)
(Repayments of) proceeds from commercial paper, net ..................... (794) (474) 1,587
Proceeds from issuance of long-term debt ............................... 1,997 2,235 3,966
Customer funds administered ......................................... (638) 31 (324)
Other, net ......................................................... (138) (27) (627)
Cash flows (used for) from financing activities ........................... (5,293) (4,946) 471
Effect of exchange rate changes on cash and cash equivalents ............... (5) (86) —
Increase (decrease) in cash and cash equivalents ........................ 219 (1,130) (1,023)
Cash and cash equivalents, beginning of period ......................... 7,276 8,406 9,429
Cash and cash equivalents, end of period .............................. $7,495 $ 7,276 $ 8,406
Supplemental cash flow disclosures
Cash paid for interest ................................................ $ 644 $ 724 $ 600
Cash paid for income taxes ........................................... 4,024 2,785 2,666
See Notes to the Consolidated Financial Statements
66