United Healthcare 2008 Annual Report Download - page 58
Download and view the complete annual report
Please find page 58 of the 2008 United Healthcare annual report below. You can navigate through the pages in the report by either clicking on the pages listed below, or by using the keyword search tool below to find specific information within the annual report.-
 1
1 -
2
-
3
-
4
-
5
-
6
-
7
-
8
-
9
-
10
-
11
-
12
-
13
-
14
-
15
-
16
-
17
-
18
-
19
-
20
-
21
-
22
-
23
-
24
-
25
-
26
-
27
-
28
-
29
-
30
-
31
-
32
-
33
-
34
-
35
-
36
-
37
-
38
-
39
-
40
-
41
-
42
-
43
-
44
-
45
-
46
-
47
-
 48
48 -
 49
49 -
 50
50 -
 51
51 -
 52
52 -
 53
53 -
 54
54 -
 55
55 -
 56
56 -
 57
57 -
 58
58 -
 59
59 -
 60
60 -
 61
61 -
 62
62 -
 63
63 -
 64
64 -
 65
65 -
 66
66 -
 67
67 -
 68
68 -
69
-
70
-
71
-
72
-
73
-
74
-
75
-
76
-
77
-
78
-
79
-
80
-
81
-
82
-
83
-
84
-
85
-
86
-
87
-
88
-
89
-
90
-
91
-
92
-
93
-
94
-
95
-
96
-
97
-
98
-
99
-
100
-
101
-
102
-
103
-
104
-
105
-
106
-
107
-
108
-
109
-
110
-
111
-
112
-
113
-
114
-
115
-
116
-
117
-
118
-
119
-
120
-
121
-
122
-
123
-
124
-
125
-
126
-
127
-
128
-
129
-
130
-
131
-
132
 |
 |

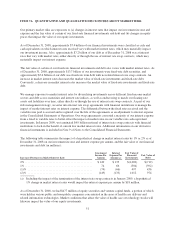
Control, as well as through a review of near-term completion factors. This approach is consistently applied from
period to period.
Completion factors are the most significant factors we use in developing our medical costs payable estimates for
older periods, generally periods prior to the most recent three months. The following table illustrates the
sensitivity of these factors and the estimated potential impact on our medical costs payable estimates for those
periods as of December 31, 2008:
Completion Factors
Increase (Decrease) in Factors
Increase (Decrease)
in Medical Costs
(in millions)
(0.75)% ..................................................................... $148
(0.50)% ..................................................................... $ 99
(0.25)% ..................................................................... $ 49
0.25% ...................................................................... $ (49)
0.50% ...................................................................... $ (98)
0.75% ...................................................................... $(146)
Medical cost PMPM trend factors are the most significant factors we use in developing our medical costs payable
estimates for the most recent three months. The following table illustrates the sensitivity of these factors and the
estimated potential impact on our medical costs payable estimates for the most recent three months as of
December 31, 2008:
Medical Cost PMPM Trend
Increase (Decrease) in Factors
Increase (Decrease)
in Medical Costs
(in millions)
3%......................................................................... $281
2%......................................................................... $187
1%......................................................................... $ 94
(1)% ....................................................................... $ (94)
(2)% ....................................................................... $(187)
(3)% ....................................................................... $(281)
The analyses above include those outcomes that are considered reasonably likely based on our historical
experience estimating liabilities for incurred but not reported benefit claims.
In order to evaluate the impact of changes in medical cost estimates for any particular discrete period, one should
consider both the amount of development recorded in the current period pertaining to prior periods and the
amount of development recorded in subsequent periods pertaining to the current period. The accompanying table
provides a summary of the net impact of favorable development on medical costs and earnings from operations:
(in millions)
Favorable
Development
Increase (Decrease)
to Medical Costs (a)
Medical Costs Earnings from Operations
As Reported As Adjusted (b) As Reported As Adjusted (b)
2006 ............. $430 $ 10 $53,308 $53,318 $6,984 $6,974
2007 ............. $420 $190 $55,435 $55,625 $7,849 $7,659
2008 ............. $230 $ (c) $60,359 $ (c) $5,263 $ (c)
(a) The amount of favorable development recorded in the current year pertaining to the prior year less the
amount of favorable development recorded in the subsequent year pertaining to the current year.
(b) Represents reported amounts adjusted to reflect the net impact of medical cost development.
(c) Not yet determinable as the amount of prior period development recorded in 2009 will change as our
December 31, 2008 medical costs payable estimate develops throughout 2009.
48