United Healthcare 2008 Annual Report Download - page 53
Download and view the complete annual report
Please find page 53 of the 2008 United Healthcare annual report below. You can navigate through the pages in the report by either clicking on the pages listed below, or by using the keyword search tool below to find specific information within the annual report.-
 1
1 -
2
-
3
-
4
-
5
-
6
-
7
-
8
-
9
-
10
-
11
-
12
-
13
-
14
-
15
-
16
-
17
-
18
-
19
-
20
-
21
-
22
-
23
-
24
-
25
-
26
-
27
-
28
-
29
-
30
-
31
-
32
-
33
-
34
-
35
-
36
-
37
-
38
-
39
-
40
-
41
-
42
-
 43
43 -
 44
44 -
 45
45 -
 46
46 -
 47
47 -
 48
48 -
 49
49 -
 50
50 -
 51
51 -
 52
52 -
 53
53 -
 54
54 -
 55
55 -
 56
56 -
 57
57 -
 58
58 -
 59
59 -
 60
60 -
 61
61 -
 62
62 -
 63
63 -
64
-
65
-
66
-
67
-
68
-
69
-
70
-
71
-
72
-
73
-
74
-
75
-
76
-
77
-
78
-
79
-
80
-
81
-
82
-
83
-
84
-
85
-
86
-
87
-
88
-
89
-
90
-
91
-
92
-
93
-
94
-
95
-
96
-
97
-
98
-
99
-
100
-
101
-
102
-
103
-
104
-
105
-
106
-
107
-
108
-
109
-
110
-
111
-
112
-
113
-
114
-
115
-
116
-
117
-
118
-
119
-
120
-
121
-
122
-
123
-
124
-
125
-
126
-
127
-
128
-
129
-
130
-
131
-
132
 |
 |

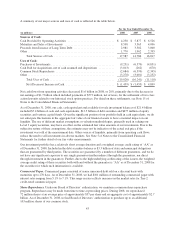
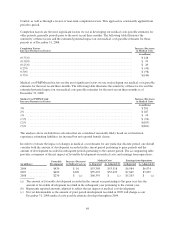
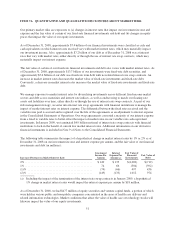
A summary of our major sources and uses of cash is reflected in the table below.
For the Year Ended December 31,
(in millions) 2008 2007 2006
Sources of Cash:
Cash Provided by Operating Activities ................................ $ 4,238 $ 5,877 $ 6,526
Maturities and Sales of Investments .................................. 8,598 3,365 4,096
Proceeds from Issuance of Long-Term Debt ............................ 2,981 3,582 3,000
Other ........................................................... 1,770 1,962 2,395
Total Sources of Cash ......................................... 17,587 14,786 16,017
Uses of Cash:
Purchases of Investments ........................................... (9,251) (6,379) (4,851)
Cash Paid for Acquisitions, net of cash assumed and dispositions ........... (3,813) (262) (670)
Common Stock Repurchases ........................................ (2,684) (6,599) (2,345)
Other ........................................................... (3,278) (3,001) (3,252)
Total Uses of Cash ............................................ (19,026) (16,241) (11,118)
Net (Decrease) Increase in Cash ................................. $ (1,439) $ (1,455) $ 4,899
Net cash flows from operating activities decreased $1.6 billion in 2008, or 28%, primarily due to the decrease in
net earnings of $1.7 billion which included payments of $573 million, net of taxes, for the settlement of two class
action lawsuits related to our historical stock option practices. For detail on these settlements, see Note 15 of
Notes to the Consolidated Financial Statements.
As of December 31, 2008, our cash, cash equivalent and available-for-sale investment balances of $21.4 billion
included $7.4 billion of cash and cash equivalents, $13.5 billion of debt securities and $477 million of equity
securities and venture capital funds. Given the significant portion of our portfolio held in cash equivalents, we do
not anticipate fluctuations in the aggregate fair value of our financial assets to have a material impact on our
liquidity. The use of different market assumptions or valuation methodologies, primarily used in valuing our
Level 3 equity securities, may have an effect on the estimated fair value amounts of our investments. Due to the
subjective nature of these assumptions, the estimates may not be indicative of the actual exit price if the
investment was sold at the measurement date. Other sources of liquidity, primarily from operating cash flows,
reduce the need to sell investments in adverse markets. See Note 5 of Notes to the Consolidated Financial
Statements for further detail of our fair value measurements.
Our investment portfolio has a relatively short average duration and a weighted average credit rating of “AA” as
of December 31, 2008. Included in the debt securities balance is $3.3 billion of state and municipal obligations
that are guaranteed by third parties. The securities are guaranteed by a number of different guarantors, and we do
not have any significant exposure to any single guarantor (neither indirect through the guarantees, nor direct
through investment in the guarantor). Further, due to the high underlying credit rating of the issuers, the weighted
average credit rating of these securities both with and without the guarantee is “AA” as of December 31, 2008 for
the securities for which such information is available.
Commercial Paper. Commercial paper consisted of senior unsecured debt sold on a discount basis with
maturities up to 270 days. As of December 31, 2008, we had $101 million of outstanding commercial paper with
interest rates ranging from 5.1% to 7.1%. This range in rates reflects increases in the market rates for Tier-2
credit-rated commercial paper.
Share Repurchases. Under our Board of Directors’ authorization, we maintain a common share repurchase
program. Repurchases may be made from time to time at prevailing prices. During 2008, we repurchased
72 million shares at an average price of approximately $37 per share and an aggregate cost of approximately $2.7
billion. As of December 31, 2008, we had Board of Directors’ authorization to purchase up to an additional
103 million shares of our common stock.
43