United Healthcare 2008 Annual Report Download - page 51
Download and view the complete annual report
Please find page 51 of the 2008 United Healthcare annual report below. You can navigate through the pages in the report by either clicking on the pages listed below, or by using the keyword search tool below to find specific information within the annual report.-
 1
1 -
2
-
3
-
4
-
5
-
6
-
7
-
8
-
9
-
10
-
11
-
12
-
13
-
14
-
15
-
16
-
17
-
18
-
19
-
20
-
21
-
22
-
23
-
24
-
25
-
26
-
27
-
28
-
29
-
30
-
31
-
32
-
33
-
34
-
35
-
36
-
37
-
38
-
39
-
40
-
 41
41 -
 42
42 -
 43
43 -
 44
44 -
 45
45 -
 46
46 -
 47
47 -
 48
48 -
 49
49 -
 50
50 -
 51
51 -
 52
52 -
 53
53 -
 54
54 -
 55
55 -
 56
56 -
 57
57 -
 58
58 -
 59
59 -
 60
60 -
 61
61 -
62
-
63
-
64
-
65
-
66
-
67
-
68
-
69
-
70
-
71
-
72
-
73
-
74
-
75
-
76
-
77
-
78
-
79
-
80
-
81
-
82
-
83
-
84
-
85
-
86
-
87
-
88
-
89
-
90
-
91
-
92
-
93
-
94
-
95
-
96
-
97
-
98
-
99
-
100
-
101
-
102
-
103
-
104
-
105
-
106
-
107
-
108
-
109
-
110
-
111
-
112
-
113
-
114
-
115
-
116
-
117
-
118
-
119
-
120
-
121
-
122
-
123
-
124
-
125
-
126
-
127
-
128
-
129
-
130
-
131
-
132
 |
 |
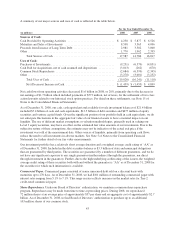
resulted from an increase in AmeriChoice revenues of $750 million, or 20%, over 2006 primarily due to an
increase in the number of individuals served by Medicaid products as well as rate increases.
The increase in Health Care Services earnings from operations in 2007 was principally driven by a decrease in
the medical care ratio for Ovations primarily due to favorable medical cost trends and an increase in the number
of individuals served by certain Medicare products and related rate increases discussed above, partially offset by
a decrease in individuals served by commercial risk-based products and an increase in the related medical care
ratio. The UnitedHealthcare medical care ratio increased to 82.6% in 2007 from 80.5% in 2006. This increase
was mainly due to our internal pricing decisions in a competitive commercial risk-based pricing environment as
well as a shift from favorable medical cost development for UnitedHealthcare during 2006 to unfavorable
medical cost development during 2007, which was partially driven by costs from higher benefit utilization in
December 2006 primarily relating to high-deductible risk-based products. The Health Care Services operating
margin for 2007 was 9.3%, an increase from 8.6% in 2006, which reflected productivity gains from technology
deployment and disciplined operating cost management as well as the factors discussed above.
The increase in the number of individuals served with commercial fee-based products as of December 31, 2007
was driven by new customer relationships and customers converting from risk-based products to fee-based
products, partially offset by employment attrition at continuing customers. The number of individuals served
with commercial risk-based products decreased primarily due to a competitive pricing environment and the
conversion of individuals to fee-based products.
The number of individuals served by Medicare Advantage products as of December 31, 2007 decreased primarily
due to a decline in participation in private-fee-for-service offerings, while individuals served by standardized
Medicare supplement products increased due to new customer relationships. Medicaid enrollment increased in
2007 primarily due to new customer gains, including 180,000 individuals served under the TennCare program in
Tennessee.
OptumHealth
The OptumHealth revenues increase was principally driven by an increase in the number of individuals served by
several of its specialty benefit businesses and rate increases related to these businesses.
OptumHealth earnings from operations increased in 2007 primarily due to the membership growth and rate
increases. The OptumHealth operating margin declined from 18.6% in 2006 to 18.2% in 2007 due to a continued
business mix shift toward higher revenue, lower margin products, partially offset by effective operating cost
management.
Ingenix
The Ingenix revenues increase in 2007 was primarily driven by new business growth in the health information
and contract research businesses as well as from businesses acquired since the beginning of 2006.
The increase in earnings from operations was primarily due to growth in the health information and contract
research businesses, businesses acquired since the beginning of 2006 and effective operating cost management.
The operating margin was 20.4% in 2007, up from 18.4% in 2006. This increase in operating margin was largely
driven by business growth and operating cost management described above.
Prescription Solutions
The Prescription Solutions revenues increase in 2007 was primarily driven by providing prescription drug benefit
services to an additional four million Ovations Medicare Advantage and stand-alone Part D members.
41