Under Armour 2007 Annual Report Download - page 45
Download and view the complete annual report
Please find page 45 of the 2007 Under Armour annual report below. You can navigate through the pages in the report by either clicking on the pages listed below, or by using the keyword search tool below to find specific information within the annual report.-
 1
1 -
2
-
3
-
4
-
5
-
6
-
7
-
8
-
9
-
10
-
11
-
12
-
13
-
14
-
15
-
16
-
17
-
18
-
19
-
20
-
21
-
22
-
23
-
24
-
25
-
26
-
27
-
28
-
29
-
30
-
31
-
32
-
33
-
34
-
 35
35 -
 36
36 -
 37
37 -
 38
38 -
 39
39 -
 40
40 -
 41
41 -
 42
42 -
 43
43 -
 44
44 -
 45
45 -
 46
46 -
 47
47 -
 48
48 -
 49
49 -
 50
50 -
 51
51 -
 52
52 -
 53
53 -
 54
54 -
 55
55 -
56
-
57
-
58
-
59
-
60
-
61
-
62
-
63
-
64
-
65
-
66
-
67
-
68
-
69
-
70
-
71
-
72
-
73
-
74
-
75
-
76
-
77
-
78
-
79
-
80
-
81
-
82
-
83
-
84
-
85
-
86
-
87
-
88
-
89
-
90
-
91
-
92
 |
 |

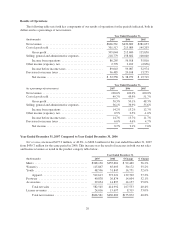
included being in stock in core product offerings, which are products that we plan to have available for sale over
the next twelve months and beyond at full price. In addition, our inventory strategy included shipping seasonal
product at the start of the shipping window in order to maximize the productivity of our floor sets and
earmarking any seasonal excess for our retail outlet stores. In 2008, we plan to continue to focus on meeting
consumer demand while improving our inventory efficiency.
We believe that our cash and cash equivalents on hand, cash from operations and borrowings available to us
under our revolving credit and subordinated debt facilities will be adequate to meet our liquidity needs and
capital expenditure requirements for at least the next twelve months. As our business continues to grow, we may
consider additional funding sources to meet our liquidity and capital needs.
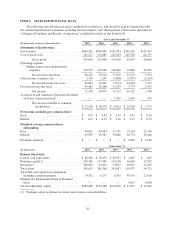
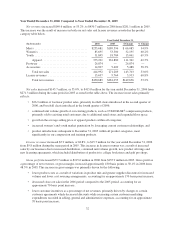
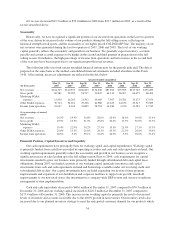
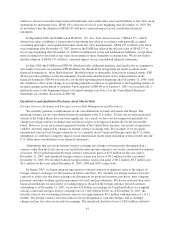
Cash Flows
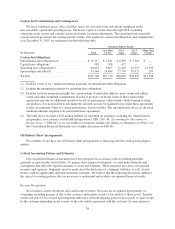
The following table presents the major components of net cash flows used in and provided by operating,
investing and financing activities for the years presented:
Year Ended December 31,
(In thousands) 2007 2006 2005
Net cash (used in) provided by:
Operating activities ................................ $(14,628) $ 10,701 $ 15,795
Investing activities ................................. (34,084) (15,115) (10,833)
Financing activities ................................ 18,148 12,579 56,989
Effect of exchange rate changes on cash and cash
equivalents ..................................... 497 (487) (59)
Net (decrease) increase in cash and cash equivalents .......... $(30,067) $ 7,678 $ 61,892
Operating Activities
Operating activities consist primarily of net income adjusted for certain non-cash items. Non-cash items
include depreciation and amortization, unrealized foreign currency transaction gains and losses, stock-based
compensation, deferred income taxes and changes in reserves for doubtful accounts, returns, discounts and
inventories. In addition, operating cash flows include the effect of changes in operating assets and liabilities,
principally accounts receivable, inventories, accounts payable, accrued expenses and income taxes payable and
receivable.
Cash used in operating activities was $14.6 million for the year ended December 31, 2007 compared to cash
provided by operating activities of $10.7 million during the same period in 2006. The $25.3 million additional
net use of cash in operating activities was due to increased cash outflows from operating assets and liabilities of
$45.6 million, partially offset by increased non-cash items of $6.7 million and an increase in net income of $13.6
million year-over-year. The increase in cash outflows related to changes in operating assets and liabilities period-
over-period was primarily due to the following:
• a larger increase in inventory levels of $57.5 million, primarily due to our planned strategy for
additional core inventory needed to support the anticipated consumer demand for our products, higher
average cost per unit due to product mix and increased in-transit inventory as a result of increased
sourcing from Asia;
• increased accounts receivable driven by a 29.0% increase in net sales for the three months ended
December 31, 2007 compared to the same period of the prior year; partially offset by
• lower income taxes receivable in 2007 compared to 2006.
Non-cash items primarily increased in 2007 as a result of higher depreciation and amortization expense
relating to the expansion of our distribution and corporate facilities and our footwear promotional rights, higher
35