Under Armour 2007 Annual Report Download - page 43
Download and view the complete annual report
Please find page 43 of the 2007 Under Armour annual report below. You can navigate through the pages in the report by either clicking on the pages listed below, or by using the keyword search tool below to find specific information within the annual report.-
 1
1 -
2
-
3
-
4
-
5
-
6
-
7
-
8
-
9
-
10
-
11
-
12
-
13
-
14
-
15
-
16
-
17
-
18
-
19
-
20
-
21
-
22
-
23
-
24
-
25
-
26
-
27
-
28
-
29
-
30
-
31
-
32
-
 33
33 -
 34
34 -
 35
35 -
 36
36 -
 37
37 -
 38
38 -
 39
39 -
 40
40 -
 41
41 -
 42
42 -
 43
43 -
 44
44 -
 45
45 -
 46
46 -
 47
47 -
 48
48 -
 49
49 -
 50
50 -
 51
51 -
 52
52 -
 53
53 -
54
-
55
-
56
-
57
-
58
-
59
-
60
-
61
-
62
-
63
-
64
-
65
-
66
-
67
-
68
-
69
-
70
-
71
-
72
-
73
-
74
-
75
-
76
-
77
-
78
-
79
-
80
-
81
-
82
-
83
-
84
-
85
-
86
-
87
-
88
-
89
-
90
-
91
-
92
 |
 |
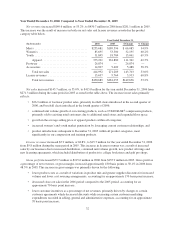
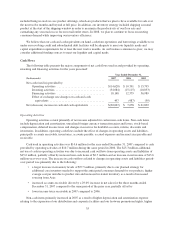
• increased direct to consumer higher margin sales, accounting for an approximate 50 basis point
increase; partially offset by
• increased sales returns and allowances, accounting for an approximate 70 basis point decrease; and
• lower gross margin attributable to the introduction of our footwear products which had lower profit
margins than our apparel products, accounting for an approximate 120 basis point decrease.
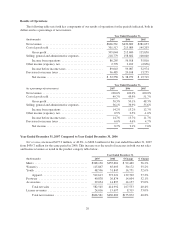
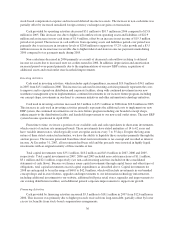
Selling, general and administrative expenses increased $58.7 million, or 58.6%, to $158.7 million in 2006
from $100.0 million in 2005. As a percentage of net revenues, selling, general and administrative expenses
increased to 36.9% in 2006 from 35.6% in 2005. These changes were primarily attributable to the following:
• Marketing costs increased $17.8 million to $48.3 million in 2006 from $30.5 million in 2005 primarily
due to the footwear promotional rights for the NFL and sponsorship of new teams on the collegiate
level, increased in-store marketing signage and fixtures, film and print advertising campaigns,
increased costs to support the development of our website and catalog initiatives, and marketing
payroll. As a percentage of net revenues, marketing costs increased to 11.2% in 2006 from 10.8% in
2005 due primarily to the items described above.
• Selling costs increased $14.5 million to $32.9 million in 2006 from $18.4 million in 2005. This
increase was primarily due to the continued investment in our international growth initiatives,
including the establishment of our European distribution, the continued development of our retail outlet
stores, increased headcount in our sales force, and additional trade show and sales meeting
expenditures. As a percentage of net revenues, selling costs increased to 7.6% in 2006 from 6.6% in
2005 primarily due to our international growth initiatives and the continued development of our retail
outlet stores.
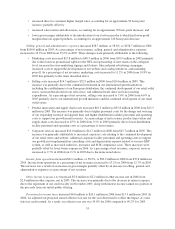
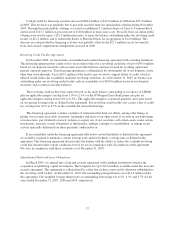
• Product innovation and supply chain costs increased $10.3 million to $35.8 million in 2006 from $25.5
million in 2005. The increase was primarily due to higher personnel costs for the design and sourcing
of our expanding footwear and apparel lines and higher distribution facilities personnel and operating
costs to support our growth in net revenues. As a percentage of net revenues, product innovation and
supply chain costs decreased to 8.3% in 2006 from 9.1% in 2005 primarily due to lower distribution
facility personnel and operating costs as a percentage of net revenues.
• Corporate services increased $16.0 million to $41.7 million in 2006 from $25.7 million in 2005. This
increase was primarily attributable to increased corporate costs relating to the continued development
of our retail stores and website, additional corporate facility personnel and operating costs to support
our growth, post-implementation consulting costs and depreciation expense related to our new ERP
system, as well as increased audit fees, insurance and SOX compliance costs. These increases were
partially offset by lower bonus expense in 2006. As a percentage of net revenues, corporate services
increased to 9.7% in 2006 from 9.1% in 2005 due to the items noted above.
Income from operations increased $21.1 million, or 58.9%, to $56.9 million in 2006 from $35.8 million in
2005. Income from operations as a percentage of net revenues increased to 13.2% in 2006 from 12.7% in 2005.
This increase was a result of an increase in gross margin partially offset by an increase in selling, general and
administrative expenses as a percentage of net revenues.
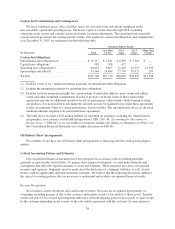
Other income (expense), net increased $5.0 million to $2.2 million in other income, net in 2006 from
$2.8 million in other expense, net in 2005. This increase was primarily due to the decrease in interest expense
due to the repayment of our credit facility in November 2005, along with interest income earned on a portion of
the proceeds from our initial public offering.
Provision for income taxes increased $6.8 million to $20.1 million in 2006 from $13.3 million in 2005. In
2006, we adjusted our projected annual effective tax rate for the year downward to reflect the impact of a new
state tax credit earned. As a result, our effective tax rate was 34.0% for 2006 compared to 40.2% for 2005.
33