Under Armour 2007 Annual Report Download - page 35
Download and view the complete annual report
Please find page 35 of the 2007 Under Armour annual report below. You can navigate through the pages in the report by either clicking on the pages listed below, or by using the keyword search tool below to find specific information within the annual report.-
 1
1 -
2
-
3
-
4
-
5
-
6
-
7
-
8
-
9
-
10
-
11
-
12
-
13
-
14
-
15
-
16
-
17
-
18
-
19
-
20
-
21
-
22
-
23
-
24
-
 25
25 -
 26
26 -
 27
27 -
 28
28 -
 29
29 -
 30
30 -
 31
31 -
 32
32 -
 33
33 -
 34
34 -
 35
35 -
 36
36 -
 37
37 -
 38
38 -
 39
39 -
 40
40 -
 41
41 -
 42
42 -
 43
43 -
 44
44 -
 45
45 -
46
-
47
-
48
-
49
-
50
-
51
-
52
-
53
-
54
-
55
-
56
-
57
-
58
-
59
-
60
-
61
-
62
-
63
-
64
-
65
-
66
-
67
-
68
-
69
-
70
-
71
-
72
-
73
-
74
-
75
-
76
-
77
-
78
-
79
-
80
-
81
-
82
-
83
-
84
-
85
-
86
-
87
-
88
-
89
-
90
-
91
-
92
 |
 |

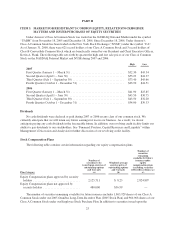
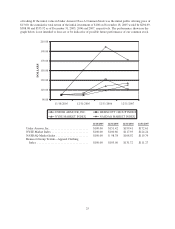
of trading. If the initial value in Under Armour Class A Common Stock was the initial public offering price of
$13.00, the cumulative total return of the initial investment of $100 on November 18, 2005 would be $294.69,
$388.08 and $335.92 as of December 31, 2005, 2006 and 2007, respectively. The performance shown on the
graph below is not intended to forecast or be indicative of possible future performance of our common stock.
90.00
110.00
130.00
150.00
170.00
190.00
210.00
11/18/2005 12/31/2005 12/31/2006 12/31/2007
DOLLARS
UNDER ARMOUR, INC. HEMSCOTT GROUP INDEX
NYSE MARKET INDEX NASDAQ MARKET INDEX
11/18/2005 12/31/2005 12/31/2006 12/31/2007
Under Armour, Inc. .......................... $100.00 $151.42 $199.41 $172.61
NYSE Market Index ......................... $100.00 $100.66 $117.93 $124.24
NASDAQ Market Index ...................... $100.00 $ 98.78 $108.92 $119.74
Hemscott Group Textile—Apparel Clothing
Index ................................... $100.00 $103.00 $131.72 $111.27
25