Under Armour 2007 Annual Report Download - page 41
Download and view the complete annual report
Please find page 41 of the 2007 Under Armour annual report below. You can navigate through the pages in the report by either clicking on the pages listed below, or by using the keyword search tool below to find specific information within the annual report.-
 1
1 -
2
-
3
-
4
-
5
-
6
-
7
-
8
-
9
-
10
-
11
-
12
-
13
-
14
-
15
-
16
-
17
-
18
-
19
-
20
-
21
-
22
-
23
-
24
-
25
-
26
-
27
-
28
-
29
-
30
-
 31
31 -
 32
32 -
 33
33 -
 34
34 -
 35
35 -
 36
36 -
 37
37 -
 38
38 -
 39
39 -
 40
40 -
 41
41 -
 42
42 -
 43
43 -
 44
44 -
 45
45 -
 46
46 -
 47
47 -
 48
48 -
 49
49 -
 50
50 -
 51
51 -
52
-
53
-
54
-
55
-
56
-
57
-
58
-
59
-
60
-
61
-
62
-
63
-
64
-
65
-
66
-
67
-
68
-
69
-
70
-
71
-
72
-
73
-
74
-
75
-
76
-
77
-
78
-
79
-
80
-
81
-
82
-
83
-
84
-
85
-
86
-
87
-
88
-
89
-
90
-
91
-
92
 |
 |
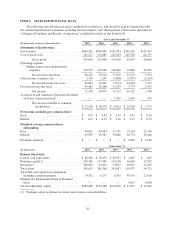
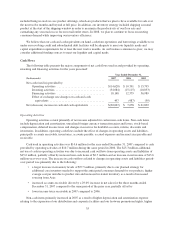
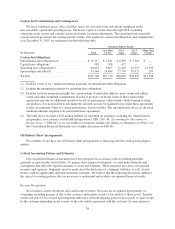
force through our growth in net revenues, which was partially offset by costs incurred for the continued
development of our retail stores and website.
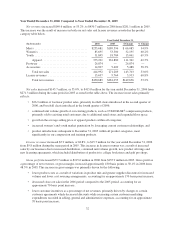
• Product innovation and supply chain costs increased $13.8 million to $49.6 million for the year ended
December 31, 2007 from $35.8 million in 2006. This increase was primarily due to higher distribution
facilities personnel and operating costs incurred to support our growth in net revenues and higher
personnel costs for the sourcing and design of our expanding footwear and apparel lines. As a
percentage of net revenues, product innovation and supply chain costs decreased to 8.2% for the year
ended December 31, 2007 from 8.3% in 2006 primarily due to lower distribution facilities personnel
and operating costs as a percentage of net revenues, partially offset by higher personnel costs for the
sourcing and production planning of our expanding footwear and apparel lines.
• Corporate services increased $13.3 million to $55.0 million for the year ended December 31, 2007
from $41.7 million in 2006. This increase was attributable primarily to additional corporate facility
personnel and operating costs to support our growth, increased corporate costs relating to the continued
development of our European, retail stores and website initiatives, as well as higher stock-based
compensation and bonus expense during 2007 as compared to 2006. These increases were partially
offset by lower Sarbanes Oxley Act of 2002 Section 404 (“SOX”) compliance costs. As a percentage of
net revenues, corporate services costs decreased to 9.1% for the year ended December 31, 2007 from
9.7% in 2006 due to lower SOX compliance costs, consulting expenses relating to our Enterprise
Resource Planning (“ERP”) system and legal expenses. These decreases were partially offset by
increased corporate costs relating to the continued development of our European, retail stores and
website initiatives as a percentage of net revenues.
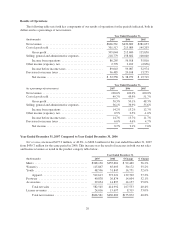
Income from operations increased $29.4 million, or 51.6%, to $86.3 million for the year ended
December 31, 2007 from $56.9 million for the same period in 2006. Income from operations as a percentage of
net revenues increased to 14.2% for the year ended December 31, 2007 from 13.2% for the same period in 2006.
This increase was a result of a decrease in selling, general and administrative expenses and an increase to gross
profit as a percentage of net revenues as discussed above.
Other income, net increased $0.6 million to $2.8 million for the year ended December 31, 2007 from
$2.2 million for the same period in 2006. This increase was primarily due to gains on foreign currency exchange
rate changes on transactions, partially offset by losses on derivative financial instruments and lower interest
income earned on short-term investments and cash and cash equivalents.
Provision for income taxes increased $16.4 million to $36.5 million for the year ended December 31, 2007
from $20.1 million for the same period in 2006. For the year ended December 31, 2007, our effective tax rate
was 41.0% compared to 34.0% for the same period in 2006. Our annual 2007 effective tax rate is higher than our
2006 annual effective tax rate primarily due to the impact of 2006 state tax credits.
Net income increased $13.6 million to $52.6 million for the year ended December 31, 2007 from
$39.0 million for the same period in 2006, as a result of the factors described above.
31