Under Armour 2007 Annual Report Download - page 36
Download and view the complete annual report
Please find page 36 of the 2007 Under Armour annual report below. You can navigate through the pages in the report by either clicking on the pages listed below, or by using the keyword search tool below to find specific information within the annual report.-
 1
1 -
2
-
3
-
4
-
5
-
6
-
7
-
8
-
9
-
10
-
11
-
12
-
13
-
14
-
15
-
16
-
17
-
18
-
19
-
20
-
21
-
22
-
23
-
24
-
25
-
 26
26 -
 27
27 -
 28
28 -
 29
29 -
 30
30 -
 31
31 -
 32
32 -
 33
33 -
 34
34 -
 35
35 -
 36
36 -
 37
37 -
 38
38 -
 39
39 -
 40
40 -
 41
41 -
 42
42 -
 43
43 -
 44
44 -
 45
45 -
 46
46 -
47
-
48
-
49
-
50
-
51
-
52
-
53
-
54
-
55
-
56
-
57
-
58
-
59
-
60
-
61
-
62
-
63
-
64
-
65
-
66
-
67
-
68
-
69
-
70
-
71
-
72
-
73
-
74
-
75
-
76
-
77
-
78
-
79
-
80
-
81
-
82
-
83
-
84
-
85
-
86
-
87
-
88
-
89
-
90
-
91
-
92
 |
 |

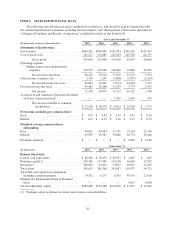
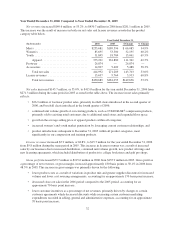
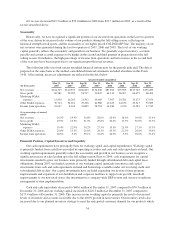
ITEM 6. SELECTED FINANCIAL DATA
The following selected financial data is qualified by reference to, and should be read in conjunction with,
the consolidated financial statements, including the notes thereto, and “Management’s Discussion and Analysis
of Financial Condition and Results of Operations” included elsewhere in this Form 10-K.
Year Ended December 31,
(In thousands, except per share amounts) 2007 2006 2005 2004 2003
Statements of Income data:
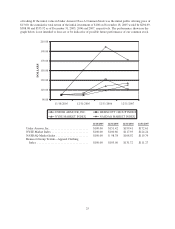
Net revenues ............................. $606,561 $430,689 $281,053 $205,181 $115,419
Cost of goods sold ........................ 301,517 215,089 145,203 109,748 64,757
Gross profit ...................... 305,044 215,600 135,850 95,433 50,662
Operating expenses
Selling, general and administrative
expenses .......................... 218,779 158,682 100,040 70,280 40,709
Income from operations ............ 86,265 56,918 35,810 25,153 9,953
Other income (expense), net ................. 2,778 2,169 (2,836) (1,057) (2,214)
Income before income taxes ......... 89,043 59,087 32,974 24,096 7,739
Provision for income taxes .................. 36,485 20,108 13,255 7,774 1,991
Net income ...................... 52,558 38,979 19,719 16,322 5,748
Accretion of and cumulative preferred dividends
on Series A preferred stock ............... — — 5,307 1,994 475
Net income available to common
stockholders ................... $ 52,558 $ 38,979 $ 14,412 $ 14,328 $ 5,273
Net income available per common share:
Basic ................................... $ 1.09 $ 0.83 $ 0.39 $ 0.41 $ 0.16
Diluted ................................. $ 1.05 $ 0.79 $ 0.36 $ 0.39 $ 0.15
Weighted average common shares
outstanding:
Basic ................................... 48,021 46,983 37,199 35,124 32,106
Diluted ................................. 49,959 49,587 39,686 36,774 34,146
Dividends declared ........................ $ — $ — $ — $ 5,000 $ 3,640
At December 31,
(In thousands) 2007 2006 2005 2004 2003
Balance Sheet data:
Cash & cash equivalents ................... $ 40,588 $ 70,655 $ 62,977 $ 1,085 $ 667
Working capital(1) ........................ 226,546 173,389 134,118 16,690 13,822
Inventories .............................. 166,082 81,031 53,607 48,055 21,849
Total assets .............................. 390,613 289,368 203,687 110,977 54,725
Total debt and capital lease obligations,
including current maturities ............... 14,332 6,257 8,391 45,133 22,018
Mandatorily Redeemable Series A Preferred
Stock ................................. — — — 6,692 4,698
Total stockholders’ equity .................. $280,485 $214,388 $150,830 $ 21,237 $ 11,865
(1) Working capital is defined as current assets minus current liabilities.
26