Under Armour 2007 Annual Report Download - page 39
Download and view the complete annual report
Please find page 39 of the 2007 Under Armour annual report below. You can navigate through the pages in the report by either clicking on the pages listed below, or by using the keyword search tool below to find specific information within the annual report.-
 1
1 -
2
-
3
-
4
-
5
-
6
-
7
-
8
-
9
-
10
-
11
-
12
-
13
-
14
-
15
-
16
-
17
-
18
-
19
-
20
-
21
-
22
-
23
-
24
-
25
-
26
-
27
-
28
-
 29
29 -
 30
30 -
 31
31 -
 32
32 -
 33
33 -
 34
34 -
 35
35 -
 36
36 -
 37
37 -
 38
38 -
 39
39 -
 40
40 -
 41
41 -
 42
42 -
 43
43 -
 44
44 -
 45
45 -
 46
46 -
 47
47 -
 48
48 -
 49
49 -
50
-
51
-
52
-
53
-
54
-
55
-
56
-
57
-
58
-
59
-
60
-
61
-
62
-
63
-
64
-
65
-
66
-
67
-
68
-
69
-
70
-
71
-
72
-
73
-
74
-
75
-
76
-
77
-
78
-
79
-
80
-
81
-
82
-
83
-
84
-
85
-
86
-
87
-
88
-
89
-
90
-
91
-
92
 |
 |

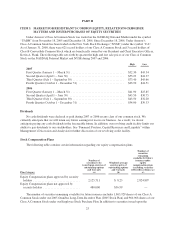
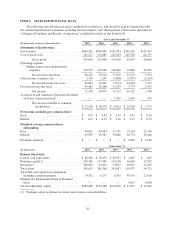
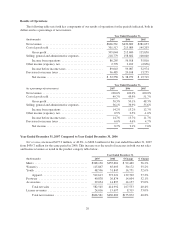
Results of Operations
The following table sets forth key components of our results of operations for the periods indicated, both in
dollars and as a percentage of net revenues.
Year Ended December 31,
(In thousands) 2007 2006 2005
Net revenues ......................................... $606,561 $430,689 $281,053
Cost of goods sold .................................... 301,517 215,089 145,203
Gross profit ...................................... 305,044 215,600 135,850
Selling, general and administrative expenses ................ 218,779 158,682 100,040
Income from operations ............................ 86,265 56,918 35,810
Other income (expense), net ............................. 2,778 2,169 (2,836)
Income before income taxes ......................... 89,043 59,087 32,974
Provision for income taxes .............................. 36,485 20,108 13,255
Net income ...................................... $ 52,558 $ 38,979 $ 19,719
Year Ended December 31,
(As a percentage of net revenues) 2007 2006 2005
Net revenues ......................................... 100.0% 100.0% 100.0%
Cost of goods sold .................................... 49.7% 49.9% 51.7%
Gross profit ...................................... 50.3% 50.1% 48.3%
Selling, general and administrative expenses ................ 36.1% 36.9% 35.6%
Income from operations ............................ 14.2% 13.2% 12.7%
Other income (expense), net ............................. 0.5% 0.5% -1.0%
Income before income taxes ......................... 14.7% 13.7% 11.7%
Provision for income taxes .............................. 6.0% 4.6% 4.7%
Net income ...................................... 8.7% 9.1% 7.0%
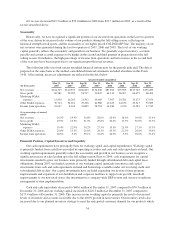
Year Ended December 31, 2007 Compared to Year Ended December 31, 2006
Net revenues increased $175.9 million, or 40.8%, to $606.6 million for the year ended December 31, 2007
from $430.7 million for the same period in 2006. This increase was the result of increases in both our net sales
and license revenues as noted in the product category table below.
Year Ended December 31,
(In thousands) 2007 2006 $ Change % Change
Men’s .................................... $348,150 $255,681 $ 92,469 36.2%
Women’s ................................. 115,867 85,695 30,172 35.2%
Youth .................................... 48,596 31,845 16,751 52.6%
Apparel ............................... 512,613 373,221 139,392 37.3%
Footwear ................................. 40,878 26,874 14,004 52.1%
Accessories ............................... 29,054 14,897 14,157 95.0%
Total net sales ......................... 582,545 414,992 167,553 40.4%
License revenues ........................... 24,016 15,697 8,319 53.0%
Total net revenues ...................... $606,561 $430,689 $175,872 40.8%
29