Ulta 2013 Annual Report Download - page 55
Download and view the complete annual report
Please find page 55 of the 2013 Ulta annual report below. You can navigate through the pages in the report by either clicking on the pages listed below, or by using the keyword search tool below to find specific information within the annual report.-
 1
1 -
2
-
3
-
4
-
5
-
6
-
7
-
8
-
9
-
10
-
11
-
12
-
13
-
14
-
15
-
16
-
17
-
18
-
19
-
20
-
21
-
22
-
23
-
24
-
25
-
26
-
27
-
28
-
29
-
30
-
31
-
32
-
33
-
34
-
35
-
36
-
37
-
38
-
39
-
40
-
41
-
42
-
43
-
44
-
 45
45 -
 46
46 -
 47
47 -
 48
48 -
 49
49 -
 50
50 -
 51
51 -
 52
52 -
 53
53 -
 54
54 -
 55
55 -
 56
56 -
 57
57 -
 58
58 -
 59
59 -
 60
60 -
 61
61 -
 62
62 -
 63
63 -
 64
64 -
 65
65 -
66
-
67
-
68
-
69
-
70
-
71
-
72
-
73
-
74
-
75
-
76
-
77
-
78
-
79
-
80
 |
 |

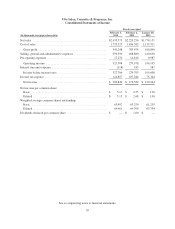
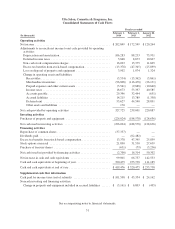
Ulta Salon, Cosmetics & Fragrance, Inc.
Consolidated Statements of Cash Flows
Fiscal year ended
February 1, February 2, January 28,
(In thousands) 2014 2013 2012
Operating activities
Net income ................................................... $202,849 $ 172,549 $ 120,264
Adjustments to reconcile net income to net cash provided by operating
activities:
Depreciation and amortization .................................. 106,283 88,233 75,931
Deferred income taxes ........................................ 3,868 8,673 10,827
Non-cash stock compensation charges ............................ 16,003 13,375 11,605
Excess tax benefits from stock-based compensation ................. (13,378) (47,345) (25,899)
Loss on disposal of property and equipment ....................... 3,902 1,074 1,324
Change in operating assets and liabilities:
Receivables ............................................... (5,534) (15,362) (3,861)
Merchandise inventories .................................... (96,808) (116,478) (26,131)
Prepaid expenses and other current assets ....................... (5,541) (9,888) (10,640)
Income taxes .............................................. 18,673 53,397 40,585
Accounts payable .......................................... 29,396 32,444 (651)
Accrued liabilities ......................................... 14,215 13,789 (1,358)
Deferred rent ............................................. 53,627 44,540 28,891
Other assets and liabilities ................................... 170 — —
Net cash provided by operating activities ........................... 327,725 239,001 220,887
Investing activities
Purchases of property and equipment .............................. (226,024) (188,578) (128,636)
Net cash used in investing activities ............................... (226,024) (188,578) (128,636)
Financing activities
Repurchase of common shares .................................... (37,337) — —
Dividends paid ................................................ — (62,482) —
Excess tax benefits from stock-based compensation ................... 13,378 47,345 25,899
Stock options exercised ......................................... 21,890 31,530 27,639
Purchase of treasury shares ...................................... (631) (79) (3,236)
Net cash (used in) provided by financing activities .................... (2,700) 16,314 50,302
Net increase in cash and cash equivalents ........................... 99,001 66,737 142,553
Cash and cash equivalents at beginning of year ....................... 320,475 253,738 111,185
Cash and cash equivalents at end of year ............................ $419,476 $ 320,475 $ 253,738
Supplemental cash flow information
Cash paid for income taxes (net of refunds) ......................... $101,598 $ 45,354 $ 24,162
Noncash investing and financing activities:
Change in property and equipment included in accrued liabilities ...... $ (3,161) $ 6,803 $ (495)
See accompanying notes to financial statements.
51