Ulta 2013 Annual Report Download - page 35
Download and view the complete annual report
Please find page 35 of the 2013 Ulta annual report below. You can navigate through the pages in the report by either clicking on the pages listed below, or by using the keyword search tool below to find specific information within the annual report.-
 1
1 -
2
-
3
-
4
-
5
-
6
-
7
-
8
-
9
-
10
-
11
-
12
-
13
-
14
-
15
-
16
-
17
-
18
-
19
-
20
-
21
-
22
-
23
-
24
-
 25
25 -
 26
26 -
 27
27 -
 28
28 -
 29
29 -
 30
30 -
 31
31 -
 32
32 -
 33
33 -
 34
34 -
 35
35 -
 36
36 -
 37
37 -
 38
38 -
 39
39 -
 40
40 -
 41
41 -
 42
42 -
 43
43 -
 44
44 -
 45
45 -
46
-
47
-
48
-
49
-
50
-
51
-
52
-
53
-
54
-
55
-
56
-
57
-
58
-
59
-
60
-
61
-
62
-
63
-
64
-
65
-
66
-
67
-
68
-
69
-
70
-
71
-
72
-
73
-
74
-
75
-
76
-
77
-
78
-
79
-
80
 |
 |

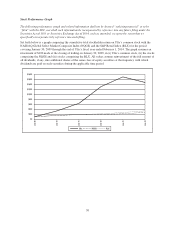
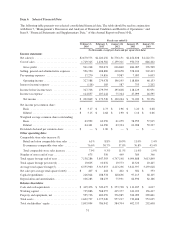
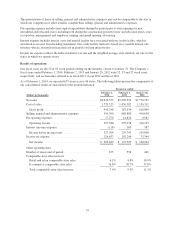
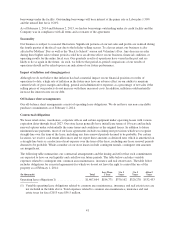
Item 6. Selected Financial Data
The following table presents our selected consolidated financial data. The table should be read in conjunction
with Item 7, “Management’s Discussion and Analysis of Financial Condition and Results of Operations,” and
Item 8, “Financial Statements and Supplementary Data,” of this Annual Report on Form 10-K.
Fiscal year ended(1)
February 1,
2014
February 2,
2013
January 28,
2012
January 29,
2011
January 30,
2010
(In thousands, except per share and per square foot data)
Income statement:
Net sales(2) .............................. $2,670,573 $2,220,256 $1,776,151 $1,454,838 $1,222,771
Cost of sales .............................. 1,729,325 1,436,582 1,159,311 970,753 846,202
Gross profit ............................ 941,248 783,674 616,840 484,085 376,569
Selling, general and administrative expenses .... 596,390 488,880 410,658 358,106 302,413
Pre-opening expenses ...................... 17,270 14,816 9,987 7,095 6,003
Operating income ........................ 327,588 279,978 196,195 118,884 68,153
Interest (income) expense ................... (118) 185 587 755 2,202
Income before income taxes ................. 327,706 279,793 195,608 118,129 65,951
Income tax expense ........................ 124,857 107,244 75,344 47,099 26,595
Net income ............................. $ 202,849 $ 172,549 $ 120,264 $ 71,030 $ 39,356
Net income per common share:
Basic ................................. $ 3.17 $ 2.73 $ 1.96 $ 1.20 $ 0.68
Diluted ................................ $ 3.15 $ 2.68 $ 1.90 $ 1.16 $ 0.66
Weighted average common shares outstanding:
Basic ................................. 63,992 63,250 61,259 58,959 57,915
Diluted ................................ 64,461 64,396 63,334 61,288 59,237
Dividends declared per common share ......... $ — $ 1.00 $ — $ — $ —
Other operating data:
Comparable store sales increase:(3)
Retail and salon comparable store sales ...... 6.1% 8.8% 10.9% 11.0% 1.4%
E-commerce comparable store sales ......... 76.6% 30.7% 37.8% 76.8% 45.4%
Total comparable store sales increase ........ 7.9% 9.3% 11.5% 11.9% 1.9%
Number of stores end of year ................. 675 550 449 389 346
Total square footage end of year .............. 7,158,286 5,847,393 4,747,148 4,094,808 3,613,840
Total square footage per store(4) .............. 10,605 10,632 10,573 10,526 10,445
Average total square footage(5) ............... 6,555,960 5,315,653 4,413,236 3,811,597 3,459,628
Net sales per average total square foot(6) ....... $ 407 $ 418 $ 402 $ 382 $ 353
Capital expenditures ....................... 226,024 188,578 128,636 97,115 68,105
Depreciation and amortization ................ 106,283 88,233 75,931 64,936 62,166
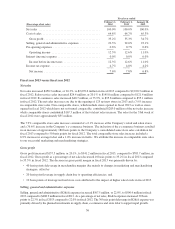
Balance sheet data:
Cash and cash equivalents ................... $ 419,476 $ 320,475 $ 253,738 $ 111,185 $ 4,017
Working capital ........................... 735,886 568,257 415,377 241,032 136,417
Property and equipment, net ................. 595,736 483,059 376,985 326,099 290,861
Total assets ............................... 1,602,727 1,275,249 957,217 730,488 553,635
Total stockholders’ equity ................... 1,003,094 786,942 584,704 402,533 292,608
31