Ulta 2013 Annual Report Download - page 40
Download and view the complete annual report
Please find page 40 of the 2013 Ulta annual report below. You can navigate through the pages in the report by either clicking on the pages listed below, or by using the keyword search tool below to find specific information within the annual report.-
 1
1 -
2
-
3
-
4
-
5
-
6
-
7
-
8
-
9
-
10
-
11
-
12
-
13
-
14
-
15
-
16
-
17
-
18
-
19
-
20
-
21
-
22
-
23
-
24
-
25
-
26
-
27
-
28
-
29
-
 30
30 -
 31
31 -
 32
32 -
 33
33 -
 34
34 -
 35
35 -
 36
36 -
 37
37 -
 38
38 -
 39
39 -
 40
40 -
 41
41 -
 42
42 -
 43
43 -
 44
44 -
 45
45 -
 46
46 -
 47
47 -
 48
48 -
 49
49 -
 50
50 -
51
-
52
-
53
-
54
-
55
-
56
-
57
-
58
-
59
-
60
-
61
-
62
-
63
-
64
-
65
-
66
-
67
-
68
-
69
-
70
-
71
-
72
-
73
-
74
-
75
-
76
-
77
-
78
-
79
-
80
 |
 |

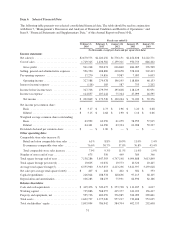
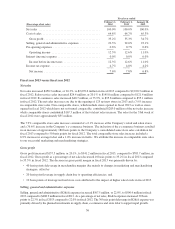
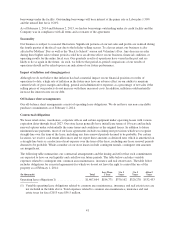
Fiscal year ended
(Percentage of net sales)
February 1,
2014
February 2,
2013
January 28,
2012
Net sales .......................................... 100.0% 100.0% 100.0%
Cost of sales ....................................... 64.8% 64.7% 65.3%
Gross profit ...................................... 35.2% 35.3% 34.7%
Selling, general and administrative expenses .............. 22.3% 22.0% 23.1%
Pre-opening expenses ................................ 0.6% 0.7% 0.6%
Operating income ................................. 12.3% 12.6% 11.0%
Interest (income) expense ............................. 0.0% 0.0% 0.0%
Income before income taxes ......................... 12.3% 12.6% 11.0%
Income tax expense .................................. 4.7% 4.8% 4.2%
Net income ...................................... 7.6% 7.8% 6.8%
Fiscal year 2013 versus fiscal year 2012
Net sales
Net sales increased $450.3 million, or 20.3%, to $2,670.6 million in fiscal 2013 compared to $2,220.3 million in
fiscal 2012. Salon service sales increased $24.4 million, or 20.1% to $145.8 million compared to $121.4 million
in fiscal 2012. E-commerce sales increased $40.7 million, or 73.9%, to $95.8 million compared to $55.1 million
in fiscal 2012. The net sales increases are due to the opening of 125 net new stores in 2013 and a 7.9% increase
in comparable store sales. Non-comparable stores, which include stores opened in fiscal 2013 as well as stores
opened in fiscal 2012 which have not yet turned comparable, contributed $283.0 million of the net sales increase
while comparable stores contributed $167.3 million of the total net sales increase. The sales for the 53rd week of
fiscal 2012 were approximately $55 million.
The 7.9% comparable store sales increase consisted of a 6.1% increase at the Company’s retail and salon stores
and a 76.6% increase in the Company’s e-commerce business. The inclusion of the e-commerce business resulted
in an increase of approximately 180 basis points to the Company’s consolidated same store sales calculation for
fiscal 2013 compared to 50 basis points for fiscal 2012. The total comparable store sales increase included a
6.9% increase in average ticket and a 1.0% increase in traffic. We attribute the increase in comparable store sales
to our successful marketing and merchandising strategies.
Gross profit
Gross profit increased $157.5 million, or 20.1%, to $941.2 million in fiscal 2013, compared to $783.7 million, in
fiscal 2012. Gross profit as a percentage of net sales decreased 10 basis points to 35.2% in fiscal 2013 compared
to 35.3% in fiscal 2012. The decrease in gross profit margin in fiscal 2013 was primarily driven by:
‰40 basis points deleverage in merchandise margins due mainly to changes in marketing and merchandising
strategies; offset by
‰20 basis point leverage in supply chain due to operating efficiencies; and
‰10 basis points of leverage in fixed store costs attributed to the impact of higher sales levels in fiscal 2013.
Selling, general and administrative expenses
Selling, general and administrative (SG&A) expenses increased $107.5 million, or 22.0%, to $596.4 million in fiscal
2013 compared to $488.9 million in fiscal 2012. As a percentage of net sales, SG&A expenses increased 30 basis
points to 22.3% in fiscal 2013 compared to 22.0% in fiscal 2012. The 30 basis point deleverage in SG&A expense was
primarily driven by the planned investments in supply chain, e-commerce and store labor to support rapid growth.
36