Ulta 2013 Annual Report Download - page 42
Download and view the complete annual report
Please find page 42 of the 2013 Ulta annual report below. You can navigate through the pages in the report by either clicking on the pages listed below, or by using the keyword search tool below to find specific information within the annual report.-
 1
1 -
2
-
3
-
4
-
5
-
6
-
7
-
8
-
9
-
10
-
11
-
12
-
13
-
14
-
15
-
16
-
17
-
18
-
19
-
20
-
21
-
22
-
23
-
24
-
25
-
26
-
27
-
28
-
29
-
30
-
31
-
 32
32 -
 33
33 -
 34
34 -
 35
35 -
 36
36 -
 37
37 -
 38
38 -
 39
39 -
 40
40 -
 41
41 -
 42
42 -
 43
43 -
 44
44 -
 45
45 -
 46
46 -
 47
47 -
 48
48 -
 49
49 -
 50
50 -
 51
51 -
 52
52 -
53
-
54
-
55
-
56
-
57
-
58
-
59
-
60
-
61
-
62
-
63
-
64
-
65
-
66
-
67
-
68
-
69
-
70
-
71
-
72
-
73
-
74
-
75
-
76
-
77
-
78
-
79
-
80
 |
 |

‰40 basis points improvement in variable store and marketing expense leverage attributed to cost efficiencies
and higher sales volume.
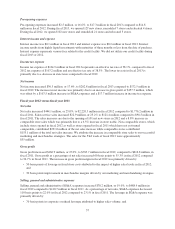
Pre-opening expenses
Pre-opening expenses increased $4.8 million, or 48.4%, to $14.8 million in fiscal 2012 compared to $10.0
million in fiscal 2011. During fiscal 2012, we opened 102 new stores, remodeled 21 stores and relocated 3 stores.
During fiscal 2011, we opened 61 new stores and remodeled 17 stores and relocated 2 stores.
Interest expense
Interest expense was $0.2 million in fiscal 2012 and $0.6 million in fiscal 2011. Interest expense for both periods
represents various fees related to the credit facility. We did not utilize our credit facility during fiscal 2012 or
2011.
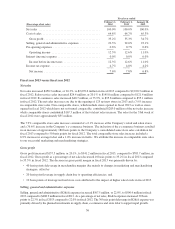
Income tax expense
Income tax expense of $107.2 million in fiscal 2012 represents an effective tax rate of 38.3%, compared to fiscal
2011 tax expense of $75.3 million and an effective tax rate of 38.5%. The lower tax rate in fiscal 2012 is
primarily due to a decrease in state taxes and less non-deductible executive compensation compared to fiscal
2011.
Net income
Net income increased $52.2 million, or 43.5%, to $172.5 million in fiscal 2012 compared to $120.3 million in
fiscal 2011. The increase in net income was primarily due to an increase in gross profit of $166.9 million, which
was offset by a $78.2 million increase in SG&A expenses and a $31.9 million increase in income tax expense.
Liquidity and capital resources
Our primary cash needs are for capital expenditures for new, relocated and remodeled stores, increased
merchandise inventories related to store expansion, supply chain improvements and for continued improvement
in our information technology systems.
Our primary sources of liquidity are cash on hand and cash flows from operations, including changes in working
capital, and borrowings under our credit facility. The most significant component of our working capital is
merchandise inventories reduced by related accounts payable and accrued expenses. Our working capital position
benefits from the fact that we generally collect cash from sales to customers the same day, or within several days
of the related sale, while we typically have up to 30 days to pay our vendors.
Our working capital needs are greatest from August through November each year as a result of our inventory
build-up during this period for the approaching holiday season. This is also the time of year when we are at
maximum investment levels in our new store class and may not have collected all of the landlord allowances due
to us as part of our lease agreements. Based on past performance and current expectations, we believe that cash
on hand, cash generated from operations and borrowings under the credit facility will satisfy the Company’s
working capital needs, capital expenditure needs, commitments, and other liquidity requirements through at least
the next 12 months.
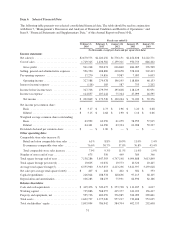
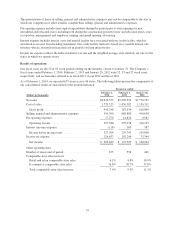
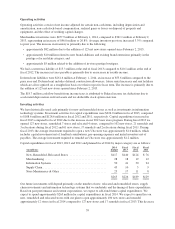
The following table presents a summary of our cash flows for fiscal years 2013, 2012 and 2011:
Fiscal year ended
(In thousands)
February 1,
2014
February 2,
2013
January 28,
2012
Net cash provided by operating activities ................ $327,725 $ 239,001 $ 220,887
Net cash used in investing activities .................... (226,024) (188,578) (128,636)
Net cash (used in) provided by financing activities ......... (2,700) 16,314 50,302
Net increase in cash and cash equivalents ................ $ 99,001 $ 66,737 $ 142,553
38