Ulta 2013 Annual Report Download - page 2
Download and view the complete annual report
Please find page 2 of the 2013 Ulta annual report below. You can navigate through the pages in the report by either clicking on the pages listed below, or by using the keyword search tool below to find specific information within the annual report.-
 1
1 -
 2
2 -
 3
3 -
 4
4 -
 5
5 -
 6
6 -
 7
7 -
 8
8 -
 9
9 -
 10
10 -
 11
11 -
 12
12 -
 13
13 -
14
-
15
-
16
-
17
-
18
-
19
-
20
-
21
-
22
-
23
-
24
-
25
-
26
-
27
-
28
-
29
-
30
-
31
-
32
-
33
-
34
-
35
-
36
-
37
-
38
-
39
-
40
-
41
-
42
-
43
-
44
-
45
-
46
-
47
-
48
-
49
-
50
-
51
-
52
-
53
-
54
-
55
-
56
-
57
-
58
-
59
-
60
-
61
-
62
-
63
-
64
-
65
-
66
-
67
-
68
-
69
-
70
-
71
-
72
-
73
-
74
-
75
-
76
-
77
-
78
-
79
-
80
 |
 |

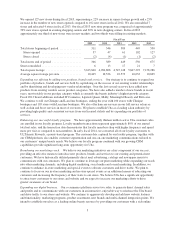
Financial Highlights
*5-Year Compound Annual Growth Rate (CAGR) is based on fiscal 2008 net sales, net income and store count of $1,084.6 million, $25.3 million and 311, respectively.
(1) Our fiscal year-end is the Saturday closest to January 31 based on a 52/53-week year. Each fiscal year consists of four 13-week quarters, with an extra week added onto the fourth quarter every five or six years.
(2) Fiscal 2012 was a 53-week operating year. The sales for the 53rd week of fiscal 2012 were approximately $55 million.
(3) Comparable store sales increase reflects sales for stores beginning on the first day of the 14th month of operation. Remodeled stores are included in comparable store sales unless the store was closed for a
portion of the current or comparable prior year.
(4) Net sales per average total square foot was calculated by dividing net sales for the year by the average square footage for those stores open during each year. The sales for the 53rd week of fiscal 2012 were
approximately $55 million.
2012 2012 20122011 2011 20112009 2009 20092010 2010 20102013 2013 2013
NET SALES (IN MILLIONS)
5-Year CAGR - 20%* 5-Year CAGR - 52%* 5-Year CAGR - 17%*
NET INCOME (IN MILLIONS)
$1,222.8
$39.4
$1,454.8
$71.0
$1,776.2
$120.3
$2,220.3
$172.5
$2,670.6 $202.8
STORE COUNT
346
389
449
550
675
2,220,256
1,436,582
783,674
488,880
14,816
279,978
185
279,793
107,244
172,549
2,670,573
1,729,325
941,248
596,390
17,270
327,588
(118)
327,706
124,857
202,849
$
$ $ $ $ $
$
$
$
$
$
$
$
$
$
$
$
$
$
$
$
$
$
$
$
$
$
$
$
$
$
$ $ $ $
2.73
2.68
63,250
64,396
1.00
3.17
3.15
63,992
64,461
–
1.96
1.90
61,259
63,334
–
1.20
1.16
58,959
61,288
–
0.68
0.66
57,915
59,237
–
Net sales (2)
Cost of sales
Gross profit
Selling, general and administrative expenses
Pre-opening expenses
Operating income
Interest (income) expense
Income before income taxes
Income tax expense
Net income
Net income per common share:
Basic
Diluted
Weighted average common shares outstanding:
Basic
Diluted
Dividends declared per common share
Comparable store sales increase (3)
Retail and salon comparable store sales
E-commerce comparable store sales
Total comparable store sales increase
Number of stores end of year
Net sales per average total square foot (4)
Capital expenditures
Depreciation and amortization
8.8%
30.7%
9.3%
550
418
188,578
88,233
6.1%
76.6%
7.9%
675
407
226,024
106,283
10.9%
37.8%
11.5%
449
402
128,636
75,931
11.0%
76.8%
11.9%
389
382
97,115
64,936
1.4%
45.4%
1.9%
346
353
68,105
62,166
Cash and cash equivalents
Working capital
Property and equipment, net
Total assets
Total stockholders’ equity
320,475
568,257
483,059
1,275,249
786,942
419,476
735,886
595,736
1,602,727
1,003,094
253,738
415,377
376,985
957,217
584,704
111,185
241,032
326,099
730,488
402,533
4,017
136,417
290,861
553,635
292,608
February 2, 2013
February 1, 2014
Income Statement:
Other Operating Data:
Balance Sheet Data:
January 28, 2012 January 29, 2011
January 30, 2010
1,776,151
1,159,311
616,840
410,658
9,987
196,195
587
195,608
75,344
120,264
1,454,838
970,753
484,085
358,106
7,095
118,884
755
118,129
47,099
71,030
FISCAL YEAR ENDED (1)
(In thousands, except per share and per square foot data)
1,222,771
846,202
376,569
302,413
6,003
68,153
2,202
65,951
26,595
39,356