Ulta 2011 Annual Report Download - page 64
Download and view the complete annual report
Please find page 64 of the 2011 Ulta annual report below. You can navigate through the pages in the report by either clicking on the pages listed below, or by using the keyword search tool below to find specific information within the annual report.-
 1
1 -
2
-
3
-
4
-
5
-
6
-
7
-
8
-
9
-
10
-
11
-
12
-
13
-
14
-
15
-
16
-
17
-
18
-
19
-
20
-
21
-
22
-
23
-
24
-
25
-
26
-
27
-
28
-
29
-
30
-
31
-
32
-
33
-
34
-
35
-
36
-
37
-
38
-
39
-
40
-
41
-
42
-
43
-
44
-
45
-
46
-
47
-
48
-
49
-
50
-
51
-
52
-
53
-
 54
54 -
 55
55 -
 56
56 -
 57
57 -
 58
58 -
 59
59 -
 60
60 -
 61
61 -
 62
62 -
 63
63 -
 64
64 -
 65
65 -
 66
66 -
 67
67 -
 68
68 -
 69
69 -
 70
70 -
 71
71 -
 72
72 -
 73
73 -
 74
74 -
75
-
76
-
77
-
78
 |
 |

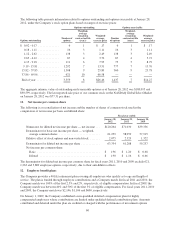
The following table presents information related to options outstanding and options exercisable at January 28,
2012, under the Company’s stock option plans based on ranges of exercise prices:
Options outstanding Options exercisable
Options outstanding
Number of
options
Weighted-
average
remaining
contractual life
(years)
Weighted-
average
exercise price
Number
of options
Weighted-
average
remaining
contractual life
(years)
Weighted-
average
exercise price
$ 0.02 - 0.17 .............. 6 1 $ .17 6 1 $ .17
0.18 - 1.11 .............. 16 3 1.11 16 3 1.11
1.12 - 2.62 .............. 138 3 2.49 138 3 2.49
2.63 - 4.12 .............. 67 4 3.72 67 4 3.72
4.13 - 9.18 .............. 111 6 7.93 73 5 8.79
9.19 - 15.81 .............. 1,292 7 13.51 777 7 13.76
15.82 - 37.85 .............. 1,308 9 25.89 360 9 23.78
37.86 - 69.96 .............. 621 10 66.58 — — —
End of year ............... 3,559 8 $26.46 1,437 7 $14.27
The aggregate intrinsic value of outstanding and exercisable options as of January 28, 2012 was $180,995 and
$90,599, respectively. The last reported sale price of our common stock on the NASDAQ Global Select Market
on January 28, 2012 was $77.31 per share.
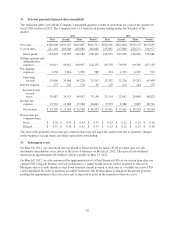
11. Net income per common share
The following is a reconciliation of net income and the number of shares of common stock used in the
computation of net income per basic and diluted share:
Fiscal year ended
January 28,
2012
January 29,
2011
January 30,
2010
Numerator for diluted net income per share — net income . . . $120,264 $71,030 $39,356
Denominator for basic net income per share — weighted-
average common shares ............................ 61,259 58,959 57,915
Dilutive effect of stock options and non-vested stock ....... 2,075 2,329 1,322
Denominator for diluted net income per share ............. 63,334 61,288 59,237
Net income per common share:
Basic ........................................... $ 1.96 $ 1.20 $ 0.68
Diluted ......................................... $ 1.90 $ 1.16 $ 0.66
The denominator for diluted net income per common share for fiscal years 2011, 2010 and 2009 exclude 621,
1,263 and 3,809 employee options, respectively, due to their anti-dilutive effects.
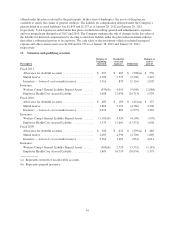
12. Employee benefit plans
The Company provides a 401(k) retirement plan covering all employees who qualify as to age and length of
service. The plan is funded through employee contributions and a Company match. In fiscal 2011 and 2010, the
Company match was 100% of the first 2.5% and 2%, respectively, of eligible compensation. In fiscal 2009, the
Company match was between 40% and 50% of the first 3% of eligible compensation. For fiscal years 2011, 2010
and 2009, the Company match was $2,146, $1,106 and $600, respectively.
On January 1, 2009, the Company established a non-qualified deferred compensation plan for highly
compensated employees whose contributions are limited under qualified defined contribution plans. Amounts
contributed and deferred under the plan are credited or charged with the performance of investment options
60