Ulta 2011 Annual Report Download - page 41
Download and view the complete annual report
Please find page 41 of the 2011 Ulta annual report below. You can navigate through the pages in the report by either clicking on the pages listed below, or by using the keyword search tool below to find specific information within the annual report.-
 1
1 -
2
-
3
-
4
-
5
-
6
-
7
-
8
-
9
-
10
-
11
-
12
-
13
-
14
-
15
-
16
-
17
-
18
-
19
-
20
-
21
-
22
-
23
-
24
-
25
-
26
-
27
-
28
-
29
-
30
-
 31
31 -
 32
32 -
 33
33 -
 34
34 -
 35
35 -
 36
36 -
 37
37 -
 38
38 -
 39
39 -
 40
40 -
 41
41 -
 42
42 -
 43
43 -
 44
44 -
 45
45 -
 46
46 -
 47
47 -
 48
48 -
 49
49 -
 50
50 -
 51
51 -
52
-
53
-
54
-
55
-
56
-
57
-
58
-
59
-
60
-
61
-
62
-
63
-
64
-
65
-
66
-
67
-
68
-
69
-
70
-
71
-
72
-
73
-
74
-
75
-
76
-
77
-
78
 |
 |

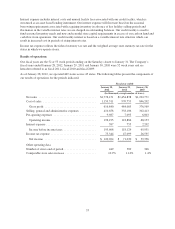
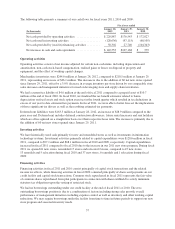
The following table presents a summary of our cash flows for fiscal years 2011, 2010 and 2009:
Fiscal year ended
(In thousands)
January 28,
2012
January 29,
2011
January 30,
2010
Net cash provided by operating activities ................ $220,887 $176,543 $ 172,827
Net cash used in investing activities .................... (128,636) (97,115) (68,105)
Net cash provided by (used in) financing activities ......... 50,302 27,740 (104,343)
Net increase in cash and cash equivalents ................ $142,553 $107,168 $ 379
Operating activities
Operating activities consist of net income adjusted for certain non-cash items, including depreciation and
amortization, non-cash stock-based compensation, realized gains or losses on disposal of property and
equipment, and the effect of working capital changes.
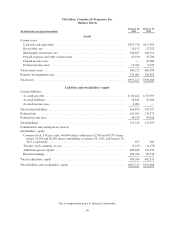
Merchandise inventories were $244.6 million at January 28, 2012, compared to $218.5 million at January 29,
2011, representing an increase of $26.1 million. The increase is due to the addition of 60 net new stores opened
since January 29, 2011, offset by a 3.0% decrease in average inventory per store driven by our comparable store
sales increases and management initiatives focused on leveraging store and supply chain inventories.
We had a current tax liability of $4.0 million at the end of fiscal 2011 compared to a prepaid asset of $10.7
million at the end of fiscal 2010. In fiscal 2010, we finalized the tax benefit estimates related to bonus
depreciation on fixed assets and stock option exercises in the fourth quarter which resulted in tax deductions in
excess of our year to date estimated tax payments. In fiscal 2011, we were able to better forecast the implications
of those significant tax drivers as well as the resulting estimated tax payments.
Deferred rent liabilities were $163.5 million at January 28, 2012, an increase of $28.9 million compared to the
prior year end. Deferred rent includes deferred construction allowances, future rental increases and rent holidays
which are all recognized on a straight-line basis over their respective lease term. The increase is primarily due to
the addition of 60 net new stores opened since January 29, 2011.
Investing activities
We have historically used cash primarily for new and remodeled stores as well as investments in information
technology systems. Investment activities primarily related to capital expenditures were $128.6 million in fiscal
2011, compared to $97.1 million and $68.1 million in fiscal 2010 and 2009, respectively. Capital expenditures
increased in fiscal 2011 compared to fiscal 2010 due to the increase in our 2011 new store program. During fiscal
2011 we opened 61 new stores, remodeled 17 stores and relocated 2 stores, compared to 47 new stores,
13 remodels and 5 relocation during fiscal 2010 and 37 new stores, 6 remodels and 1 relocation during fiscal
2009.
Financing activities
Financing activities in fiscal 2011 and 2010 consist principally of capital stock transactions and the related
income tax effects, while financing activities in fiscal 2009 consisted principally of draws and payments on our
credit facility and capital stock transactions. Common stock repurchased in fiscal 2011 represents the fair value
of common shares repurchased from plan participants in connection with shares withheld to satisfy minimum
statutory tax obligations upon the vesting of restricted stock.
We had no borrowings outstanding under our credit facility at the end of fiscal 2011 or 2010. The zero
outstanding borrowings position is due to a combination of factors including strong sales growth, overall
performance of management initiatives including expense control as well as inventory and other working capital
reductions. We may require borrowings under the facility from time to time in future periods to support our new
store program and seasonal inventory needs.
37