Ulta 2011 Annual Report Download - page 33
Download and view the complete annual report
Please find page 33 of the 2011 Ulta annual report below. You can navigate through the pages in the report by either clicking on the pages listed below, or by using the keyword search tool below to find specific information within the annual report.-
 1
1 -
2
-
3
-
4
-
5
-
6
-
7
-
8
-
9
-
10
-
11
-
12
-
13
-
14
-
15
-
16
-
17
-
18
-
19
-
20
-
21
-
22
-
 23
23 -
 24
24 -
 25
25 -
 26
26 -
 27
27 -
 28
28 -
 29
29 -
 30
30 -
 31
31 -
 32
32 -
 33
33 -
 34
34 -
 35
35 -
 36
36 -
 37
37 -
 38
38 -
 39
39 -
 40
40 -
 41
41 -
 42
42 -
 43
43 -
44
-
45
-
46
-
47
-
48
-
49
-
50
-
51
-
52
-
53
-
54
-
55
-
56
-
57
-
58
-
59
-
60
-
61
-
62
-
63
-
64
-
65
-
66
-
67
-
68
-
69
-
70
-
71
-
72
-
73
-
74
-
75
-
76
-
77
-
78
 |
 |

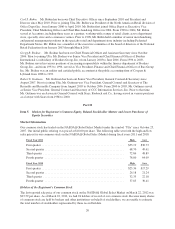
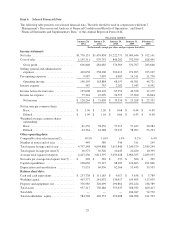
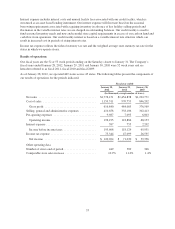
Item 6. Selected Financial Data
The following table presents our selected financial data. The table should be read in conjunction with Item 7,
“Management’s Discussion and Analysis of Financial Condition and Results of Operations,” and Item 8,
“Financial Statements and Supplementary Data,” of this Annual Report on Form 10-K.
Fiscal year ended(1)
January 28,
2012
January 29,
2011
January 30,
2010
January 31,
2009
February 2,
2008
(In thousands, except per share and per square foot data)
Income statement:
Net sales ............................ $1,776,151 $1,454,838 $1,222,771 $1,084,646 $ 912,141
Cost of sales ......................... 1,159,311 970,753 846,202 752,939 628,495
Gross profit ........................ 616,840 484,085 376,569 331,707 283,646
Selling, general and administrative
expenses .......................... 410,658 358,106 302,413 271,095 225,167
Pre-opening expenses .................. 9,987 7,095 6,003 14,311 11,758
Operating income ................... 196,195 118,884 68,153 46,301 46,721
Interest expense ....................... 587 755 2,202 3,943 4,542
Income before income taxes ............. 195,608 118,129 65,951 42,358 42,179
Income tax expense .................... 75,344 47,099 26,595 17,090 16,844
Net income ........................ $ 120,264 $ 71,030 $ 39,356 $ 25,268 $ 25,335
Net income per common share:
Basic ............................. $ 1.96 $ 1.20 $ 0.68 $ 0.44 $ 0.69
Diluted ............................ $ 1.90 $ 1.16 $ 0.66 $ 0.43 $ 0.48
Weighted average common shares
outstanding:
Basic ............................. 61,259 58,959 57,915 57,425 20,383
Diluted ............................ 63,334 61,288 59,237 58,967 53,293
Other operating data:
Comparable store sales increase(2) ........ 10.9% 11.0% 1.4% 0.2% 6.4%
Number of stores end of year ............ 449 389 346 311 249
Total square footage end of year .......... 4,747,148 4,094,808 3,613,840 3,240,579 2,589,244
Total square footage per store(3) ......... 10,573 10,526 10,445 10,420 10,399
Average total square footage(4) .......... 4,413,236 3,811,597 3,459,628 2,960,355 2,283,935
Net sales per average total square foot(5) . . . $ 402 $ 382 $ 353 $ 366 $ 399
Capital expenditures ................... 128,636 97,115 68,105 110,863 101,866
Depreciation and amortization ........... 75,931 64,936 62,166 51,445 39,503
Balance sheet data:
Cash and cash equivalents ............... $ 253,738 $ 111,185 $ 4,017 $ 3,638 $ 3,789
Working capital ....................... 415,377 241,032 136,417 159,695 117,039
Property and equipment, net ............. 376,985 326,099 290,861 292,224 236,389
Total assets .......................... 957,217 730,488 553,635 568,932 469,413
Total debt ............................———106,047 74,770
Total stockholders’ equity ............... 584,704 402,533 292,608 244,968 211,503
29