Ulta 2011 Annual Report Download - page 52
Download and view the complete annual report
Please find page 52 of the 2011 Ulta annual report below. You can navigate through the pages in the report by either clicking on the pages listed below, or by using the keyword search tool below to find specific information within the annual report.-
 1
1 -
2
-
3
-
4
-
5
-
6
-
7
-
8
-
9
-
10
-
11
-
12
-
13
-
14
-
15
-
16
-
17
-
18
-
19
-
20
-
21
-
22
-
23
-
24
-
25
-
26
-
27
-
28
-
29
-
30
-
31
-
32
-
33
-
34
-
35
-
36
-
37
-
38
-
39
-
40
-
41
-
 42
42 -
 43
43 -
 44
44 -
 45
45 -
 46
46 -
 47
47 -
 48
48 -
 49
49 -
 50
50 -
 51
51 -
 52
52 -
 53
53 -
 54
54 -
 55
55 -
 56
56 -
 57
57 -
 58
58 -
 59
59 -
 60
60 -
 61
61 -
 62
62 -
63
-
64
-
65
-
66
-
67
-
68
-
69
-
70
-
71
-
72
-
73
-
74
-
75
-
76
-
77
-
78
 |
 |

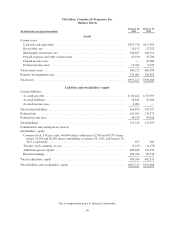
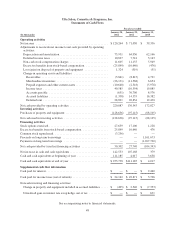
Ulta Salon, Cosmetics & Fragrance, Inc.
Statements of Cash Flows
Fiscal year ended
January 28, January 29, January 30,
(In thousands) 2012 2011 2010
Operating activities
Net income ................................................. $120,264 $ 71,030 $ 39,356
Adjustments to reconcile net income to net cash provided by operating
activities:
Depreciation and amortization ................................ 75,931 64,936 62,166
Deferred income taxes ....................................... 10,827 7,741 3,143
Non-cash stock compensation charges .......................... 11,605 11,155 5,949
Excess tax benefits from stock-based compensation ............... (25,899) (10,640) (476)
Loss (gain) on disposal of property and equipment ................ 1,324 (519) (51)
Change in operating assets and liabilities: .......................
Receivables ............................................. (3,861) (8,815) 4,791
Merchandise inventories ................................... (26,131) (11,568) 6,654
Prepaid expenses and other current assets ...................... (10,640) (2,518) (5,978)
Income taxes ............................................ 40,585 (10,354) 19,885
Accounts payable ........................................ (651) 30,706 8,576
Accrued liabilities ........................................ (1,358) 14,535 16,382
Deferred rent ............................................ 28,891 20,854 12,430
Net cash provided by operating activities .......................... 220,887 176,543 172,827
Investing activities
Purchases of property and equipment ............................. (128,636) (97,115) (68,105)
Net cash used in investing activities .............................. (128,636) (97,115) (68,105)
Financing activities
Stock options exercised ........................................ 27,639 17,100 1,228
Excess tax benefits from stock-based compensation ................. 25,899 10,640 476
Common stock repurchased .................................... (3,236) — —
Proceeds on long-term borrowings ............................... — — 1,161,673
Payments on long-term borrowings .............................. — — (1,267,720)
Net cash provided by (used in) financing activities .................. 50,302 27,740 (104,343)
Net increase in cash and cash equivalents .......................... 142,553 107,168 379
Cash and cash equivalents at beginning of year ..................... 111,185 4,017 3,638
Cash and cash equivalents at end of year .......................... $253,738 $111,185 $ 4,017
Supplemental cash flow information
Cash paid for interest .......................................... $ — $ — $ 2,440
Cash paid for income taxes (net of refunds) ........................ $ 24,162 $ 49,871 $ 3,706
Noncash investing and financing activities:
Change in property and equipment included in accrued liabilities ..... $ (495) $ 2,540 $ (7,353)
Unrealized gain on interest rate swap hedge, net of tax ............. $ — $ — $ 631
See accompanying notes to financial statements.
48