Ulta 2011 Annual Report Download - page 2
Download and view the complete annual report
Please find page 2 of the 2011 Ulta annual report below. You can navigate through the pages in the report by either clicking on the pages listed below, or by using the keyword search tool below to find specific information within the annual report.-
 1
1 -
 2
2 -
 3
3 -
 4
4 -
 5
5 -
 6
6 -
 7
7 -
 8
8 -
 9
9 -
 10
10 -
 11
11 -
 12
12 -
 13
13 -
14
-
15
-
16
-
17
-
18
-
19
-
20
-
21
-
22
-
23
-
24
-
25
-
26
-
27
-
28
-
29
-
30
-
31
-
32
-
33
-
34
-
35
-
36
-
37
-
38
-
39
-
40
-
41
-
42
-
43
-
44
-
45
-
46
-
47
-
48
-
49
-
50
-
51
-
52
-
53
-
54
-
55
-
56
-
57
-
58
-
59
-
60
-
61
-
62
-
63
-
64
-
65
-
66
-
67
-
68
-
69
-
70
-
71
-
72
-
73
-
74
-
75
-
76
-
77
-
78
 |
 |

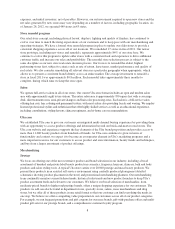
2007 2008 2009 2010 2011
Net sales
Cost of sales
Gross profit
Selling, general & administrative expenses
Pre-opening expenses
Operating income
Interest expense
Income before income taxes
Income tax expense
Net income
Net income per common share:
Basic
Diluted
Comparable store sales increase(2)
Number of stores end of year
Net sales per average total square foot(3)
Capital expenditures
Depreciation and amortization
Cash and cash equivalents
Working capital
Property and equipment, net
Total assets
Total debt
Total stockholders' equity
Fiscal year ended (1)
January 28, 2012
1,776,151
1,159,311
616,840
410,658
9,987
196,195
587
195,608
75,344
120,264
1.90
10.9%
449
402
128,636
75,931
415,377
376,985
957,217
–
584,704
January 29, 2011
970,753
484,085
358,106
7,095
118,884
755
118,129
47,099
71,030
1.20
1.16
11.0%
389
382
97,115
64,936
111,185
241,032
326,099
730,488
–
402,533
January 30, 2010
846,202
376,569
302,413
6,003
68,153
2,202
65,951
26,595
0.68
0.66
1.4%
346
353
68,105
62,166
4,017
136,417
290,861
553,635
–
292,608
January 31, 2009
752,939
331,707
271,095
14,311
46,301
3,943
42,358
17,090
25,268
0.44
0.2%
311
366
110,863
51,445
3,638
159,695
292,224
568,932
106,047
244,968
February 2, 2008
$ 912,141
628,495
283,646
225,167
11,758
46,721
4,542
42,179
16,844
25,335
0.69
0.48
6.4%
249
399
101,866
39,503
3,789
117,039
236,389
469,413
74,770
211,503
(1) Our fiscal year-end is the Saturday closest to January 31 based on a 52/53-week year. Each fiscal year consists of four 13-week quarters, with an extra week added onto the fourth
quarter every five or six years.
(2) Comparable store sales increase reflects sales for stores beginning on the first day of the 14th month of operation. Remodeled stores are included in comparable store sales unless the
store was closed for a portion of the current or comparable prior year.
(3) Net sales per average total square foot was calculated by dividing net sales for the year by the average square footage for those stores open during each year.
Income statement:
(In thousands, except per share and per square foot data)
Other operating data:
Balance sheet data:
2007 2008 2009 2010 2011
$1,776.2
$1,454.8
$1,222.8
$1,084.6
$912.1
21% 19% 19% 22%
NET SALES (IN MILLIONS)
5 YEAR CAGR - 19%*
NET INCOME (IN MILLIONS)
5 YEAR CAGR - 40%*
STORE COUNT
5 YEAR CAGR - 18%*
*5-Year Compound Annual Growth Rate (CAGR) is based on fiscal 2006 net sales, net income and store count of $755.1 million, $22.5 million and 196, respectively.
$120.3
$71.0
$39.4
$25.3$25.3
80% 69%
449
389
346
311
249
27% 25% 12% 15%11%56%13% 0%
2007 2008 2009 2010 2011
12%
1.96
253,738
1,454,838
1,222,771
39,356
1,084,646
0.43
Financial Highlights
$$
$
$
$
$
$
$
$
$
$
$
$
$
$
$
$
$
$
$
$
$
$
$
$
$$
$$