Ulta 2011 Annual Report Download - page 40
Download and view the complete annual report
Please find page 40 of the 2011 Ulta annual report below. You can navigate through the pages in the report by either clicking on the pages listed below, or by using the keyword search tool below to find specific information within the annual report.-
 1
1 -
2
-
3
-
4
-
5
-
6
-
7
-
8
-
9
-
10
-
11
-
12
-
13
-
14
-
15
-
16
-
17
-
18
-
19
-
20
-
21
-
22
-
23
-
24
-
25
-
26
-
27
-
28
-
29
-
 30
30 -
 31
31 -
 32
32 -
 33
33 -
 34
34 -
 35
35 -
 36
36 -
 37
37 -
 38
38 -
 39
39 -
 40
40 -
 41
41 -
 42
42 -
 43
43 -
 44
44 -
 45
45 -
 46
46 -
 47
47 -
 48
48 -
 49
49 -
 50
50 -
51
-
52
-
53
-
54
-
55
-
56
-
57
-
58
-
59
-
60
-
61
-
62
-
63
-
64
-
65
-
66
-
67
-
68
-
69
-
70
-
71
-
72
-
73
-
74
-
75
-
76
-
77
-
78
 |
 |
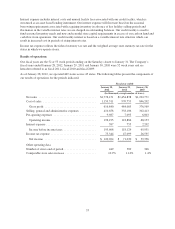
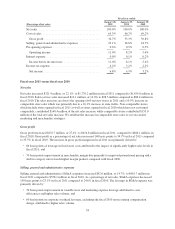
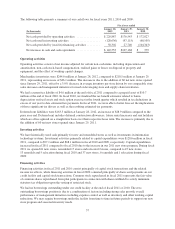
Selling, general and administrative expenses
Selling, general and administrative (SG&A) expenses increased $55.7 million, or 18.4%, to $358.1 million in
fiscal 2010 compared to $302.4 million in fiscal 2009. As a percentage of net sales, SG&A expenses decreased
10 basis points to 24.6% in fiscal 2010 compared to 24.7% in fiscal 2009. SG&A expense as a percentage of
sales was primarily impacted by:
‰40 basis points improvement in marketing expense leverage attributed to costs efficiencies and higher sales
volume; offset by
‰30 basis points deleverage due to the non-recurring executive compensation charge related to our newly
appointed President and Chief Executive Officer.
Pre-opening expenses
Pre-opening expenses increased $1.1 million, or 18.2%, to $7.1 million in fiscal 2010 compared to $6.0 million
in fiscal 2009. During fiscal 2010, we opened 47 new stores, remodeled 13 stores and relocated 5 stores. During
fiscal 2009, we opened 37 new stores and remodeled 6 stores.
Interest expense
Interest expense decreased $1.4 million, or 65.7%, to $0.8 million in fiscal 2010 compared to $2.2 million in
fiscal 2009. Fiscal 2010 interest expense represents fees associated with the credit facility. We did not utilize the
credit facility in fiscal 2010.
Income tax expense
Income tax expense of $47.1 million in fiscal 2010 represents an effective tax rate of 39.9%, compared to fiscal
2009 tax expense of $26.6 million and an effective tax rate of 40.3%. The decrease in the effective tax rate in
fiscal 2010 is primarily attributed to the large number of stock option exercises and share sales deemed to be
disqualifying dispositions.
Net income
Net income increased $31.6 million, or 80.5%, to $71.0 million in fiscal 2010 compared to $39.4 million in fiscal
2009. The increase in net income was primarily due to an increase in gross profit of $107.5 million, which was
offset by a $55.7 million increase in SG&A expenses and a $20.5 million increase in income tax expense.
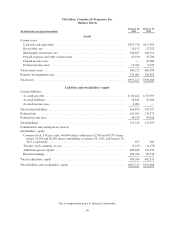
Liquidity and capital resources
Our primary cash needs are for capital expenditures for new, relocated and remodeled stores, increased
merchandise inventories related to store expansion, and for continued improvement in our information
technology systems.
Our primary sources of liquidity are cash flows from operations, including changes in working capital, and
borrowings under our credit facility. The most significant component of our working capital is merchandise
inventories reduced by related accounts payable and accrued expenses. Our working capital position benefits
from the fact that we generally collect cash from sales to customers the same day, or within several days of the
related sale, while we typically have up to 30 days to pay our vendors.
Our working capital needs are greatest from August through November each year as a result of our inventory
build-up during this period for the approaching holiday season. This is also the time of year when we are at
maximum investment levels in our new store class and may not have collected all of the landlord allowances due
to us as part of our lease agreements. Based on past performance and current expectations, we believe that cash
on hand, cash generated from operations and borrowings under the credit facility will satisfy the Company’s
working capital needs, capital expenditure needs, commitments, and other liquidity requirements through at least
the next 12 months.
36