TD Bank 2002 Annual Report Download - page 9
Download and view the complete annual report
Please find page 9 of the 2002 TD Bank annual report below. You can navigate through the pages in the report by either clicking on the pages listed below, or by using the keyword search tool below to find specific information within the annual report.-
 1
1 -
 2
2 -
 3
3 -
 4
4 -
 5
5 -
 6
6 -
 7
7 -
 8
8 -
 9
9 -
 10
10 -
 11
11 -
 12
12 -
 13
13 -
 14
14 -
 15
15 -
 16
16 -
 17
17 -
 18
18 -
 19
19 -
 20
20 -
21
-
22
-
23
-
24
-
25
-
26
-
27
-
28
-
29
-
30
-
31
-
32
-
33
-
34
-
35
-
36
-
37
-
38
-
39
-
40
-
41
-
42
-
43
-
44
-
45
-
46
-
47
-
48
-
49
-
50
-
51
-
52
-
53
-
54
-
55
-
56
-
57
-
58
-
59
-
60
-
61
-
62
-
63
-
64
-
65
-
66
-
67
-
68
-
69
-
70
-
71
-
72
-
73
-
74
-
75
-
76
-
77
-
78
-
79
-
80
-
81
-
82
-
83
-
84
-
85
-
86
-
87
-
88
-
89
-
90
-
91
-
92
-
93
-
94
-
95
 |
 |

7
HOW WE PERFORMED IN 2002
How we performed
How the Bank reports
The Bank prepares its financial statements in accordance with
Canadian generally accepted accounting principles (GAAP) and
are presented on pages 43 to 79 of this annual report. The Bank
refers to results prepared in accordance with GAAP as the
“reported basis”.
In addition to presenting the Bank’s results on a reported
basis, the Bank also utilizes the “operating cash basis”to
measure overall Bank performance against targeted goals. The
definition of operating cash basis begins with the reported GAAP
results and then excludes the impact of special items. For fiscal
2002, the only special item excluded was a gain on sale of the
Bank’s mutual fund record keeping and custody business. Prior
year results excluded special items resulting from restructuring
costs related to acquisitions and significant business
restructuring initiatives (TD Securities in the fourth quarter
2001, TD Waterhouse in the third quarter 2001, Newcrest in
the first quarter 2001 and Canada Trust in the second quarter
2000), the effects of future tax rate reductions on future tax
balances in the first and third quarter 2001, and the effect of
real estate gains and general allowance increases in the first and
second quarter 2001. The Bank views these restructuring costs
and special items as transactions that are not part of the Bank’s
normal daily business operations and are therefore not indicative
of underlying trends. In addition, the Bank also excludes non-
cash charges related to goodwill and identified intangible
amortization from business combinations. Excluding the non-
cash amortization charges for goodwill and intangibles ensures
comparable treatment between periods and treats goodwill and
identified intangibles in a similar manner. Consequently, the
Bank believes that the operating cash basis provides the reader
with an understanding of the Bank’s results that can be
consistently tracked from period to period.
As explained, operating cash basis results are different from
reported results determined in accordance with GAAP. The term
“operating cash basis results”is not a defined term under GAAP,
and therefore may not be comparable to similar terms used by
other issuers. The table on the following page provides a
reconciliation between the Bank’s operating cash basis results
and its reported results.
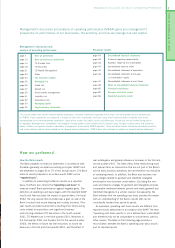
Management’s discussion and
analysis of operating performance
page 7 How we performed
page 13 How our businesses performed
page 14 TD Canada Trust
page 18 TD Securities
page 21 TD Wealth Management
page 23 Other
page 24 The economic outlook
page 25 Managing risk
page 25 Credit risk
page 27 Market risk
page 29 Asset liability management
page 31 Liquidity risk
page 32 Operational risk
page 33 Managing capital
page 35 Supplementary information
Financial results
page 43 Consolidated financial statements
page 43 Financial reporting responsibility
page 43 Auditors’ report to the shareholders
page 44 Consolidated balance sheet
page 45 Consolidated statement of operations
page 46 Consolidated statement of changes
in shareholders’ equity
page 47 Consolidated statement of cash flows
page 48 Notes to consolidated financial statements
page 80 Principal subsidiaries
page 82 Ten-year statistical review
page 86 Reported quarterly results
This annual report may contain forward-looking statements, including statements regarding the business and anticipated financial performance
of TDBFG. These statements are subject to a number of risks and uncertainties that may cause actual results to differ materially from those
contemplated by the forward-looking statements. Some of the factors that could cause such differences include but are not limited to legislative
or regulatory developments, competition, technological change, global capital market activity, interest rates, changes in government and economic
policy, inflation and general economic conditions in geographic areas where TDBFG operates. These and other factors should be considered carefully
and undue reliance should not be placed on the forward-looking statements. TDBFG does not undertake to update any forward-looking statements.
Management’s Discussion and Analysis of Operating Performance
Management’s discussion and analysis of operating performance (MD&A) gives you management’s
perspective on performance of our businesses, the economy, and how we manage risk and capital.