TD Bank 2002 Annual Report Download - page 4
Download and view the complete annual report
Please find page 4 of the 2002 TD Bank annual report below. You can navigate through the pages in the report by either clicking on the pages listed below, or by using the keyword search tool below to find specific information within the annual report.-
 1
1 -
 2
2 -
 3
3 -
 4
4 -
 5
5 -
 6
6 -
 7
7 -
 8
8 -
 9
9 -
 10
10 -
 11
11 -
 12
12 -
 13
13 -
 14
14 -
 15
15 -
16
-
17
-
18
-
19
-
20
-
21
-
22
-
23
-
24
-
25
-
26
-
27
-
28
-
29
-
30
-
31
-
32
-
33
-
34
-
35
-
36
-
37
-
38
-
39
-
40
-
41
-
42
-
43
-
44
-
45
-
46
-
47
-
48
-
49
-
50
-
51
-
52
-
53
-
54
-
55
-
56
-
57
-
58
-
59
-
60
-
61
-
62
-
63
-
64
-
65
-
66
-
67
-
68
-
69
-
70
-
71
-
72
-
73
-
74
-
75
-
76
-
77
-
78
-
79
-
80
-
81
-
82
-
83
-
84
-
85
-
86
-
87
-
88
-
89
-
90
-
91
-
92
-
93
-
94
-
95
 |
 |

2
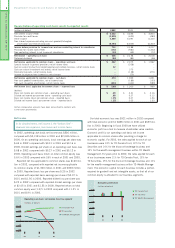
THE YEAR AT A GLANCE
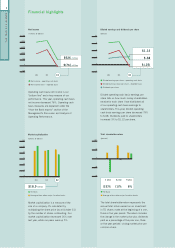
Financial highlights
0
$526 million
$(76) million
Net income
00 01 02
1,500
2,000
$2,500
1,000
500
-500
(millions of dollars)
Net income – operating cash basis
Net income (loss) – reported basis
$.68
$1.12
$(.25)
Diluted earnings and dividends per share
00 01 02
3
$4
2
1
0
-1
(dollars)
Diluted earnings per share – operating cash basis
Diluted earnings (loss) per share – reported basis
Dividends per share
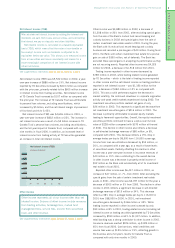
$18.9 billion
Market capitalization
0100 02
$30
25
20
15
10
5
0
(billions of dollars)
TD Bank
Average of four other major Canadian banks
6%(1)%
Total shareholder return
3 year
(15)%
1 year 5 year
20%
10
0
-10
-20
(percent)
TD Bank
Average of four other major Canadian banks
Operating cash basis net income is our
“bottom line” and a key measure of our
performance. This year, operating cash basis
net income decreased 76%. Operating cash
basis measures are explained under the
“How the Bank reports” section of the
Management's Discussion and Analysis of
Operating Performance.
Diluted operating cash basis earnings per
share tells us how much money shareholders
receive for each share if we distributed all
of our operating cash basis earnings to
shareholders. This year, diluted operating
cash basis earnings per share decreased 79%
to $.68. Dividends paid to shareholders
increased 3% to $1.12 per share.
Market capitalization is a measure of the
size of a company. It’s calculated by
multiplying the share price (as at October 31)
by the number of shares outstanding. Our
market capitalization decreased 16% over
last year, while our peers were up 5%.
The total shareholder return represents the
annual total return earned on an investment
in TD shares made at the beginning of a one,
three or five year period. The return includes
the change in the market price plus dividends
paid as a percentage of the prior one, three
or five year periods’ closing market price per
common share.