TD Bank 2002 Annual Report Download - page 17
Download and view the complete annual report
Please find page 17 of the 2002 TD Bank annual report below. You can navigate through the pages in the report by either clicking on the pages listed below, or by using the keyword search tool below to find specific information within the annual report.
15
HOW WE PERFORMED IN 2002
margins remained relatively stable throughout the year as a
result of interest rate risk hedging programs. Average volume
growth for 2002 was $4.5 billion or 4.5% for personal
lending, $3.0 billion or 3.9% for personal deposits,
$3.8 billion or 20.0% for business deposits and
$169 million or 28% for TD Meloche Monnex insurance
premiums while commercial lending contracted by
$1.2 billion or 8.4%.
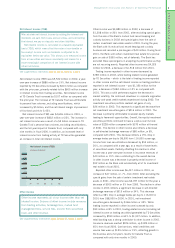
Growth in cash basis expenses was limited to 1% in 2002
compared with the prior year. Expenses in 2001 were
impacted by costs associated with the conversion of the
branch network and systems. During 2002, expense synergies
were realized through branch mergers, however investments
were made in customer service and process improvement
initiatives following the conversions. Higher rates of expense
growth were experienced in pension and benefit costs as
well as in fast growing TD Meloche Monnex. The cash basis
efficiency ratio for the year of 58.9%, an improvement of
.7 percentage points over 2001, compares with our goal for
the year of 58.5%.
During 2002, expense synergies were realized
through branch mergers, however investments
were made in customer service and process
improvement initiatives following the conversions.
The provision for credit losses for 2002 of $505 million
was $125 million or 33% higher than 2001. Approximately
half of this increase was from small business and commercial
lending returning to more normal loss levels following low
losses in 2001. Losses in 2002 also included the impact of
processing and collection issues that arose following
conversion.
During 2002, we experienced market share declines in
mortgages, term deposits and mutual funds as a result of
discount pricing by competitors, integration issues and
branch mergers. By year end, this trend in market share had
begun to stabilize. Efforts to address expected disruption
caused by the integration were successful as evidenced by
the improvement in our Retail Branch Customer Satisfaction
Index (CSI). The CSI score improved by 4.4 percentage
points from the start of the year to 84.4% and exceeded the
pre-conversion level. With this improvement in customer
satisfaction and the branch merger program substantially
complete, we are well positioned to maintain and grow
market share in a profitable manner going forward.
Cash basis net income
(millions of dollars)
00 01 02
$1,114 million
$1,200
1,000
800
600
200
400
0
Cash basis efficiency ratio
(percent)
80%
60
20
40
00 01 02
58.9 percent
0
Economic profit
(millions of dollars)
$500
400
100
200
300
0
00 01 02
$450 million


