TD Bank 2002 Annual Report Download - page 12
Download and view the complete annual report
Please find page 12 of the 2002 TD Bank annual report below. You can navigate through the pages in the report by either clicking on the pages listed below, or by using the keyword search tool below to find specific information within the annual report.-
 1
1 -
 2
2 -
 3
3 -
 4
4 -
 5
5 -
 6
6 -
 7
7 -
 8
8 -
 9
9 -
 10
10 -
 11
11 -
 12
12 -
 13
13 -
 14
14 -
 15
15 -
 16
16 -
 17
17 -
 18
18 -
 19
19 -
 20
20 -
 21
21 -
 22
22 -
23
-
24
-
25
-
26
-
27
-
28
-
29
-
30
-
31
-
32
-
33
-
34
-
35
-
36
-
37
-
38
-
39
-
40
-
41
-
42
-
43
-
44
-
45
-
46
-
47
-
48
-
49
-
50
-
51
-
52
-
53
-
54
-
55
-
56
-
57
-
58
-
59
-
60
-
61
-
62
-
63
-
64
-
65
-
66
-
67
-
68
-
69
-
70
-
71
-
72
-
73
-
74
-
75
-
76
-
77
-
78
-
79
-
80
-
81
-
82
-
83
-
84
-
85
-
86
-
87
-
88
-
89
-
90
-
91
-
92
-
93
-
94
-
95
 |
 |

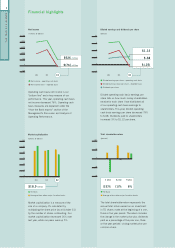
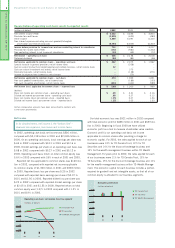
Operating cash basis other income
(billions of dollars)
020099 0198
Trading income
Net investment
securities gains
Credit fees
Investment and
securities services
Other
$3.0
2.5
2.0
1.5
1.0
0.5
0
Operating cash basis efficiency ratio
(percent)
0299 00 0198
65%
64
61
62
63
60
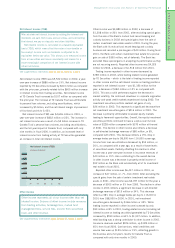
Operating cash basis expenses
(billions of dollars)
0299 00 01
98
$8
6
2
4
0
10
HOW WE PERFORMED IN 2002
from the Canada Trust acquisition, compared with only nine
months in 2000. On an after-tax basis, however, the increase in
goodwill and intangible amortization was offset by future income
tax benefits related to federal and provincial tax rate reductions.
As a result, the after-tax impact of goodwill and intangible
amortization for 2001 was $629 million compared with
$722 million in 2000.
Efficiency ratio
The efficiency ratio measures the efficiency of our operations.
It’s calculated by taking expenses (excluding non-cash goodwill
and purchase-related intangible amortization and restructuring
costs) as a percentage of total revenue (excluding special
items). The lower the percentage, the greater the efficiency.
See supplementary information page 37, table 7
On an operating cash basis, the Bank’s overall efficiency ratio
weakened to 64.9% in 2002 from 64.5% in 2001 and 61.8%
in 2000. The Bank’s overall efficiency ratio is impacted by shifts
in its business mix. The efficiency ratio is viewed as a more
relevant measure for TD Canada Trust, which had an efficiency
ratio of 58.9% this year as compared with 59.6% in 2001 and
60.9% in 2000, after excluding non-cash items and funding
costs for the acquisition of Canada Trust. On a reported basis,
the Bank’s overall efficiency ratio improved to 74.2% from
78.1% in 2001 and 79.6% in 2000. The improvement was
a result of the discontinuation of the amortization of goodwill,
lower intangible amortization and no restructuring costs in
fiscal 2002.
Expenses
Expenses include non-interest expenses, such as salaries,
occupancy and equipment costs, and other operating expenses.
See supplementary information page 37, table 7
In 2002, total operating cash basis expenses decreased by
$171 million or 2% from 2001 to $6,754 million, primarily as a
result of lower incentive compensation expenses at TD Securities.
TD Wealth Management also contributed to the decrease in the
salaries and employee benefits, evidencing the results of its
discount brokerage restructuring initiatives. For fiscal 2003, the
Bank will apply the fair value method of accounting for stock
options. For details see Note 23 on page 79 of the Bank’s
consolidated financial statements.
Operating cash basis expenses exclude non-cash goodwill and
purchase-related intangible amortization and restructuring costs
related to acquisitions and significant business restructuring
initiatives. During the fourth quarter of fiscal 2001, TD
Securities announced a restructuring of its operations, which
resulted in pre-tax restructuring costs of $130 million, primarily
related to employee severance. In fiscal 2001, the Bank incurred
pre-tax restructuring costs of $54 million related to TD
Waterhouse and $55 million related to the acquisition of
Newcrest. In fiscal 2000, the Bank incurred pre-tax restructuring
costs of $475 million related to the acquisition of Canada Trust.
On a reported basis, expenses decreased by $902 million from
2001 to $7,752 million. In fiscal 2002, the impact of non-cash
goodwill and purchase-related intangible amortization on the
Bank’s reported expenses was $998 million compared with
$1,490 million last year. Beginning in fiscal 2002, the Bank
discontinued the amortization of goodwill as a result of the
adoption of the new accounting standard on goodwill and
intangible assets.
In 2001, total operating cash basis expenses increased by
$618 million or 10% to $6,925 million from 2000. The
increase in operating cash basis expenses related to higher
performance-driven compensation tied to TD Securities’ strong
results in 2001, an increase in the number of employees needed
to support the retail branch conversions and higher business
activity at TD Canada Trust. Reported expenses increased by
$527 million or 6% to $8,654 million in 2001. In fiscal 2001,
the impact of non-cash goodwill and purchase-related intangible
amortization on the Bank’s reported expenses was $1,490 mil-
lion, compared with $1,345 million in 2000. The increase in
2001 reflects a full year of goodwill and intangible amortization
Management’s Discussion and Analysis of Operating Performance