TD Bank 2002 Annual Report Download - page 21
Download and view the complete annual report
Please find page 21 of the 2002 TD Bank annual report below. You can navigate through the pages in the report by either clicking on the pages listed below, or by using the keyword search tool below to find specific information within the annual report.-
 1
1 -
2
-
3
-
4
-
5
-
6
-
7
-
8
-
9
-
10
-
 11
11 -
 12
12 -
 13
13 -
 14
14 -
 15
15 -
 16
16 -
 17
17 -
 18
18 -
 19
19 -
 20
20 -
 21
21 -
 22
22 -
 23
23 -
 24
24 -
 25
25 -
 26
26 -
 27
27 -
 28
28 -
 29
29 -
 30
30 -
 31
31 -
32
-
33
-
34
-
35
-
36
-
37
-
38
-
39
-
40
-
41
-
42
-
43
-
44
-
45
-
46
-
47
-
48
-
49
-
50
-
51
-
52
-
53
-
54
-
55
-
56
-
57
-
58
-
59
-
60
-
61
-
62
-
63
-
64
-
65
-
66
-
67
-
68
-
69
-
70
-
71
-
72
-
73
-
74
-
75
-
76
-
77
-
78
-
79
-
80
-
81
-
82
-
83
-
84
-
85
-
86
-
87
-
88
-
89
-
90
-
91
-
92
-
93
-
94
-
95
 |
 |

19
HOW WE PERFORMED IN 2002
Fiscal 2002 was a very disappointing year for TD
Securities. While revenues proved to be relatively resilient in
what was arguably the most challenging environment in the
past 10 years, we experienced record credit losses. We are
taking decisive steps to better manage our credit exposures.
Our announcement in November 2002 to separate the
corporate lending business into core and non-core
components signaled a sharpened focus in extending credit.
Core lending will be used strategically to support broad-
based relationships which can meet or exceed our hurdle
rates of return. This approach is consistent with our strategy
to continue to grow our strong, full-service franchise in
Canada and to build relationships outside of Canada by
leveraging our industry expertise as well as our strength in
product structuring, trade execution and distribution.
Fiscal 2002 was a very disappointing year for
TD Securities. While revenues proved to be
relatively resilient in what was arguably the
most challenging environment in the past
10 years, we experienced record credit losses.
The separation of our corporate lending business also
allows for focused management of the non-core portfolio.
Non-core loans and bankers acceptances of approximately
$11 billion represent over half of TD Securities’ corporate
lending portfolio. The exposures are almost exclusively
outside of Canada and a majority of the exposures are in the
communications and utilities sectors. Approximately 40% of
the non-core portfolio is investment grade. We hold specific,
sectoral and general allowances against the non-core
portfolio of loans. The non-core portfolio strategy is to
proactively manage down the portfolio as quickly as possible
in a manner which optimizes shareholder returns. We expect
the portfolio exit to be substantially completed over the next
three years leading to the eventual redeployment of
approximately $1.2 billion in Tier 1 capital.
We will complement these actions with three additional
steps to increase the effectiveness of credit management.
First, we will implement stricter limits around credit exposure
and industry concentrations. Secondly, we will use proactive
portfolio management to identify, monitor and mitigate credit
exposures on a more comprehensive and timely basis.
Finally, we will increase our relationship managers’
accountability in extending credit. We are confident that
these actions and the actions we have already taken, will
lead to significantly lower credit losses in 2003.
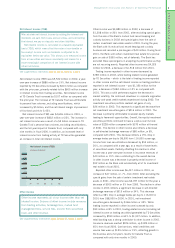
Total revenue
(millions of dollars)
00 01 02
$2,655 million
$3,500
2,500
3,000
2,000
1,500
500
1,000
0
Cash basis net income
(millions of dollars)
00 01 02
$(1,264)
$601
$1,000
500
0
(500)
(1,000)
(1,500)
Lending
Other
Total cash basis
net income (loss)
(millions of dollars)
2002 $(663) million
2001 $914
2000 $778