Suzuki 2006 Annual Report Download - page 49
Download and view the complete annual report
Please find page 49 of the 2006 Suzuki annual report below. You can navigate through the pages in the report by either clicking on the pages listed below, or by using the keyword search tool below to find specific information within the annual report.-
 1
1 -
2
-
3
-
4
-
5
-
6
-
7
-
8
-
9
-
10
-
11
-
12
-
13
-
14
-
15
-
16
-
17
-
18
-
19
-
20
-
21
-
22
-
23
-
24
-
25
-
26
-
27
-
28
-
29
-
30
-
31
-
32
-
33
-
34
-
35
-
36
-
37
-
38
-
 39
39 -
 40
40 -
 41
41 -
 42
42 -
 43
43 -
 44
44 -
 45
45 -
 46
46 -
 47
47 -
 48
48 -
 49
49 -
 50
50 -
 51
51 -
 52
52 -
 53
53
 |
 |

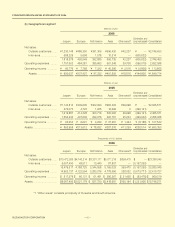
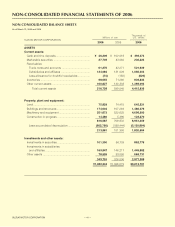
SUZUKI MOTOR CORPORATION
Thousands of
SUZUKI MOTOR CORPORATION
Millions of yen U.S. dollars
2006 2005 2006
ASSETS
Current assets:
Cash and time deposits ............................................. ¥ 46,209 ¥ 162,018 $ 393,373
Marketable securities ................................................ 27,749 43,062 236,223
Receivables:
Trade notes and accounts ..................................... 61,276 42,271 521,639
Subsidiaries and affiliates ...................................... 124,084 131,029 1,056,303
Less allowance for doubtful receivables ................ (74) (130) (629)
Inventories ................................................................. 98,655 71,292 839,833
Other current assets .................................................. 160,827 140,303 1,369,093
Total current assets 518,728 589,848 4,415,836
Property, plant and equipment:
Land ........................................................................... 75,829 74,415 645,521
Buildings and structures ............................................ 174,604 167,294 1,486,376
Machinery and equipment ......................................... 551,673 522,625 4,696,290
Construction in progress ........................................... 14,480 5,496 123,270
816,587 769,832 6,951,459
Less accumulated depreciation ............................. (602,726) (588,444) (5,130,894)
213,861 181,388 1,820,564
Investments and other assets:
Investments in securities ........................................... 101,350 86,733 862,775
Investments in subsidiaries
and affiliates ........................................................... 169,847 146,217 1,445,882
Other assets .............................................................. 78,555 93,886 668,731
349,753 326,836 2,977,389
¥1,082,344 ¥1,098,073 $9,213,791
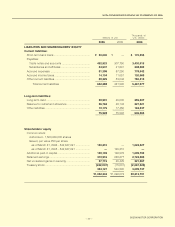
NON-CONSOLIDATED BALANCE SHEETS
As of March 31, 2006 and 2005
NON-CONSOLIDATED FINANCIAL STATEMENTS OF 2006
49