Suzuki 2006 Annual Report Download - page 4
Download and view the complete annual report
Please find page 4 of the 2006 Suzuki annual report below. You can navigate through the pages in the report by either clicking on the pages listed below, or by using the keyword search tool below to find specific information within the annual report.-
 1
1 -
 2
2 -
 3
3 -
 4
4 -
 5
5 -
 6
6 -
 7
7 -
 8
8 -
 9
9 -
 10
10 -
 11
11 -
 12
12 -
 13
13 -
 14
14 -
 15
15 -
16
-
17
-
18
-
19
-
20
-
21
-
22
-
23
-
24
-
25
-
26
-
27
-
28
-
29
-
30
-
31
-
32
-
33
-
34
-
35
-
36
-
37
-
38
-
39
-
40
-
41
-
42
-
43
-
44
-
45
-
46
-
47
-
48
-
49
-
50
-
51
-
52
-
53
 |
 |
SUZUKI MOTOR CORPORATION
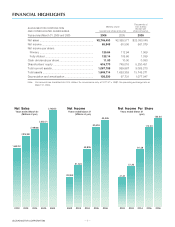
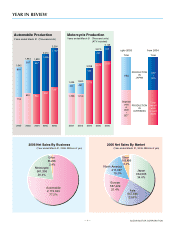
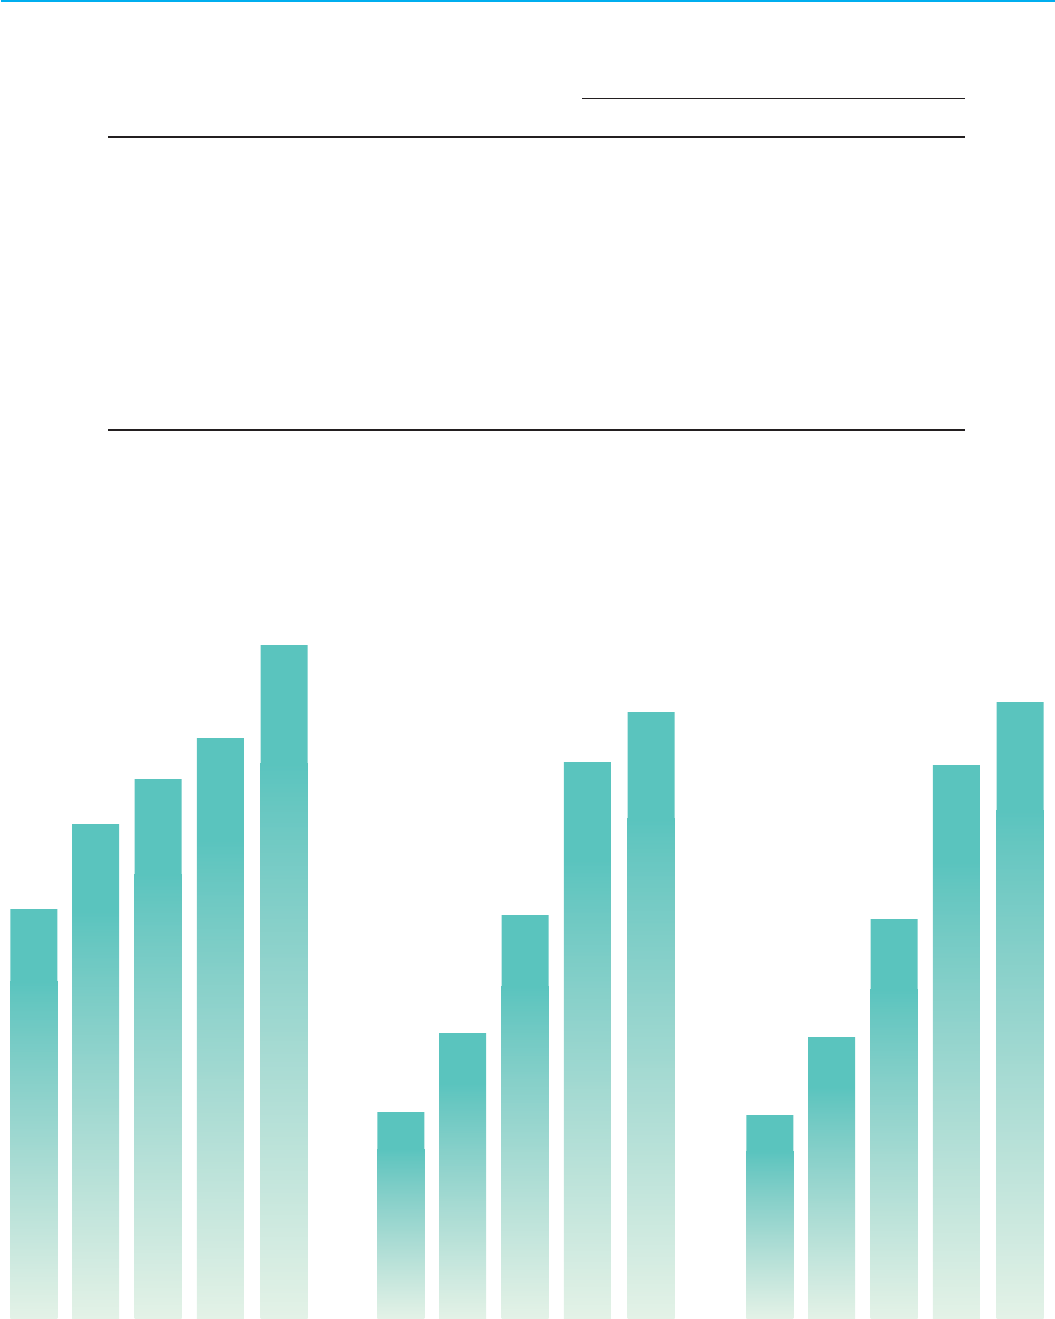
FINANCIAL HIGHLIGHTS
2003 2003
Years ended March 31
(Millions of yen)
Years ended March 31
(Millions of yen)
Years ended March 31
(yen)
2003
2,015,309
2002 2002
2002
1,668,251
Net Sales Net Income Net Income Per Share
2004 2004
2004
2,198,986
2005
2,365,571
2005
112.94
2005
60,506
2006
2,746,453
2006
125.64
41.40
57.29
81.38
2006
65,945
22,392
31,024
43,835
Thousands of
Millions of yen U.S. dollars
(except per
(except per share amounts) share amounts)
Years ended March 31, 2006 and 2005
2006 2005 2006
Net sales ....................................................................... ¥2,746,453 ¥2,365,571$1$23,380,045
Net income .................................................................... 65,945 60,506 561,379
Net income per share:
Primary ....................................................................... 125.64 112.94 1.069
Fully diluted ................................................................ 122.14 109.86 1.039
Cash dividends per share............................................. 11.00 10.00 0.093
Shareholders’ equity ..................................................... 616,770 745,016 4,65,250,451
Total current assets....................................................... 1,067,709 999,887 9,089,213
Total assets ................................................................... 1,849,714 1,693,353 115,746,271
Depreciation and amortization ...................................... 126,520 97,731 1,077,047
Note: Yen amounts are translated into U.S. dollars, for convenience only, at ¥117.47 = US$1, the prevailing exchange rate on
March 31, 2006.
SUZUKI MOTOR CORPORATION
AND CONSOLIDATED SUBSIDIARIES
3