Suzuki 2006 Annual Report Download - page 46
Download and view the complete annual report
Please find page 46 of the 2006 Suzuki annual report below. You can navigate through the pages in the report by either clicking on the pages listed below, or by using the keyword search tool below to find specific information within the annual report.-
 1
1 -
2
-
3
-
4
-
5
-
6
-
7
-
8
-
9
-
10
-
11
-
12
-
13
-
14
-
15
-
16
-
17
-
18
-
19
-
20
-
21
-
22
-
23
-
24
-
25
-
26
-
27
-
28
-
29
-
30
-
31
-
32
-
33
-
34
-
35
-
 36
36 -
 37
37 -
 38
38 -
 39
39 -
 40
40 -
 41
41 -
 42
42 -
 43
43 -
 44
44 -
 45
45 -
 46
46 -
 47
47 -
 48
48 -
 49
49 -
 50
50 -
 51
51 -
 52
52 -
 53
53
 |
 |

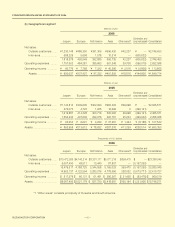
SUZUKI MOTOR CORPORATION
2005
Europe
North America
Asia
Other areas
*2
Consolidated
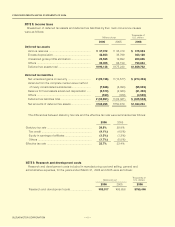
Overseas sales ................ ¥495,989 ¥324,244 ¥526,570 ¥125,701 ¥1,472,505
Consolidated net sales ....................................................................................... 2,365,571
Ratio of overseas sales
to consolidated net sales ...
21.0% 13.7% 22.3% 5.3% 62.2%
2006
Europe
North America
Asia
Other areas
*2
Consolidated
Overseas sales ................. $5,000,679 $3,501,551 $5,513,707 $1,408,840 $15,424,778
Consolidated net sales .............................................................................................. 23,380,045
Ratio of overseas sales
to consolidated net sales ...
21.4% 15.0% 23.6% 6.0% 66.0%
*2 “Other areas” consists principally of Oceania and South America.
Thousands of U. S. dollars
2006
Europe
North America
Asia
Other areas*2
Consolidated
Overseas sales ................ ¥587,429 ¥411,327 ¥647,695 ¥165,496 ¥1,811,948
Consolidated net sales ................................................................................................
2,746,453
Ratio of overseas sales
to consolidated net sales ....
21.4% 15.0% 23.6% 6.0% 66.0%
(c) Overseas sales
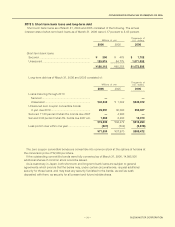
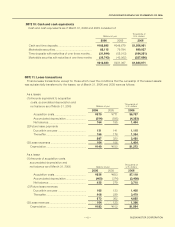
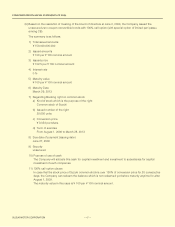
NOTE 15: Subsequent events
(a) The following plan for the appropriation of retained earnings for the year ended March 31, 2005 was approved
by the ordinary general meeting of shareholders of the Company held on June 29, 2006:
Millions of Thousands of
yen U.S. dollars
Year-end cash dividends ...................................................... ¥2,647 $22,541
Bonuses for directors and corporate auditors ...................... 260 2,213
¥2,907 $24,754
Millions of yen
CONSOLIDATED FINANCIAL STATEMENTS OF 2006
Millions of yen
46