Suzuki 2006 Annual Report Download - page 45
Download and view the complete annual report
Please find page 45 of the 2006 Suzuki annual report below. You can navigate through the pages in the report by either clicking on the pages listed below, or by using the keyword search tool below to find specific information within the annual report.-
 1
1 -
2
-
3
-
4
-
5
-
6
-
7
-
8
-
9
-
10
-
11
-
12
-
13
-
14
-
15
-
16
-
17
-
18
-
19
-
20
-
21
-
22
-
23
-
24
-
25
-
26
-
27
-
28
-
29
-
30
-
31
-
32
-
33
-
34
-
 35
35 -
 36
36 -
 37
37 -
 38
38 -
 39
39 -
 40
40 -
 41
41 -
 42
42 -
 43
43 -
 44
44 -
 45
45 -
 46
46 -
 47
47 -
 48
48 -
 49
49 -
 50
50 -
 51
51 -
 52
52 -
 53
53
 |
 |

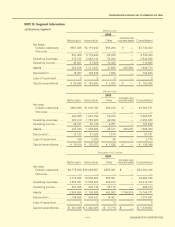
SUZUKI MOTOR CORPORATION
Millions of yen
2006
Elimination and
Japan Europe
North America
Asia
Other areas*1
corporate assets
Consolidated
Net sales:
Outside customers ......
¥1,230,148 ¥486,350 ¥391,306 ¥596,420 ¥42,227 ¥ — ¥2,746,453
Inter-area .....................
588,229 5,698 1,578 10,314 — (605,822) —
1,818,378 492,049 392,885 606,735 42,227 (605,822) 2,746,453
Operating expenses .........
1,757,602 484,281 385,663 561,348 39,708 (596,015) 2,632,588
Operating income .............
¥ 60,776 ¥ 7,768 ¥ 7,222 ¥ 45,386 ¥ 2,518 ¥ (9,806) ¥ 113,865
Assets ..........................
¥ 950,037 ¥237,427 ¥ 97,232 ¥401,592 ¥18,818 ¥144,606 ¥1,849,714
Net sales:
Outside customers ......
¥1,143,813 ¥409,605 ¥302,090 ¥483,363 ¥26,698 ¥ — ¥2,365,571
Inter-area .....................
476,073 4,722 1,625 16,699 0 (499,121) —
1,619,887 414,328 303,716 500,062 26,698 (499,121) 2,365,571
Operating expenses .........
1,554,233 407,636 299,076 462,781 25,233 (490,932) 2,258,028
Operating income .............
¥ 65,653 ¥ 6,691 ¥ 4,639 ¥ 37,281 ¥ 1,464 ¥ (8,188) ¥ 107,542
Assets ...............................
¥ 863,958 ¥213,612 ¥ 78,632 ¥287,376 ¥11,259 ¥238,514 ¥1,693,353
Net sales:
Outside customers ......
$10,472,026 $4,140,214 $3,331,117 $5,077,216 $359,470 $ — $23,380,045
Inter-area .....................
5,007,490 48,511 13,440 87,807
—
(5,157,250) —
15,479,517 4,188,725 3,344,558 5,165,023 359,470 (5,157,250) 23,380,045
Operating expenses .........
14,962,137 4,122,594 3,283,076 4,778,656 338,032 (5,073,771) 22,410,727
Operating income .............
$ 517,379 $ 66,131 $ 61,481 $ 386,367 $ 21,438 $
(83,478) $ 969,319
Assets ...............................
$8,087,492 $2,021,179 $ 827,720 $3,418,681 $160,194 $1,231,008 $15,746,271
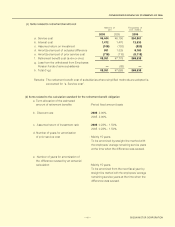
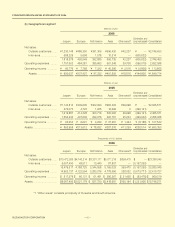
(b) Geographical segment
Thousands of U.S. dollars
2006
Elimination and
Japan Europe
North America
Asia
Other areas*1
corporate assets
Consolidated
*1 “Other areas” consists principally of Oceania and South America.
Millions of yen
2005
Elimination and
Japan Europe
North America
Asia
Other areas*1
corporate assets
Consolidated
CONSOLIDATED FINANCIAL STATEMENTS OF 2006
45