Suzuki 2006 Annual Report Download - page 25
Download and view the complete annual report
Please find page 25 of the 2006 Suzuki annual report below. You can navigate through the pages in the report by either clicking on the pages listed below, or by using the keyword search tool below to find specific information within the annual report.-
 1
1 -
2
-
3
-
4
-
5
-
6
-
7
-
8
-
9
-
10
-
11
-
12
-
13
-
14
-
 15
15 -
 16
16 -
 17
17 -
 18
18 -
 19
19 -
 20
20 -
 21
21 -
 22
22 -
 23
23 -
 24
24 -
 25
25 -
 26
26 -
 27
27 -
 28
28 -
 29
29 -
 30
30 -
 31
31 -
 32
32 -
 33
33 -
 34
34 -
 35
35 -
36
-
37
-
38
-
39
-
40
-
41
-
42
-
43
-
44
-
45
-
46
-
47
-
48
-
49
-
50
-
51
-
52
-
53
 |
 |

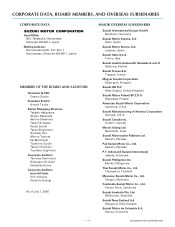
SUZUKI MOTOR CORPORATION
(e) Other areas
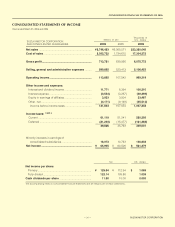
Net sales amounted to 42,227 million yen (158.2% as against PFY) and operating income to 2,518 million yen
(172.0% as against PFY) by increase of sales, etc.
(3) Selling, general and administrative expenses
In this fiscal year, the amount of selling, general and administrative expenses increased by 76,441 million yen to
599,855 million yen. The expense of dispatch, advertising, sales promotion and warranty reserve increased
according to increase of sales. Also R&D expenses increased due to development of new product, advanced safety
technology, next generation vehicle of fuel cell vehicle etc.
(4) Other income and expenses
In this fiscal year, the net amount of other income and expenses was a profit of 7,978 million yen due to increase
of interest income and gain on sales of investment in securities and decrease of impairment loss of fixed assets to
zero yen against loss of 3,774 million yen in the previous fiscal year. As a result, the net profit of this fiscal year
increase by 8,467 million yen against previous fiscal year.
(5) Outlook for results in the next fiscal year
Next fiscal period is the second year of “Suzuki Medium term 5-year Plan”. Although the Company will positively
push the precedence investment in R&D and plant and equipments, the Company and its group will work all together
for innovation in every area, getting engaged in evolution of business activities to achieve 2,800 billion yen in net
sales, 120 billion yen in ordinary income and 66 billion yen in net income. The above is based on the anticipated
foreign exchange rate of 1 US dollar = 112 yen and 1 Euro = 134 yen.
* The outlook of business results is an estimate, based on the current information available and assumption,
including risk and uncertainty. It is requested, therefore, to understand that the actual results may vary
extensively as many factors change. Those factors, which may influence the actual results, include economic
conditions, and the trend of demand in major markets and the fluctuation of foreign exchange rates (mainly the
Yen/US dollar rate; Yen/Euro rate).
2. Liquidity and capital resources
(1) Situation of cash flow
The net cash provided by operating activities increased to 240,043 million yen. This is 27,615 million yen more
than the previous fiscal year due to an increase in income before tax, depreciation and amortization expenses.
The net cash used in investing activities decreased to 104,215 million yen by 21,887 million yen. This is less than
the previous fiscal year due to decrease of term deposit over three months despite an increase in expenditure for the
purchase of property, plants and equipment.
The net cash used in financing activities increased to 160,725 million yen by 116,667 million yen. This is more
than the previous fiscal year due to purchases of treasury stock despite borrowing for capital investment in India.
As a result, the balance of cash and cash equivalents at the end of this fiscal year decreased by 14,774 million
yen to 216,623 million yen, compared with the previous fiscal year.
(2) Demand for money
During this fiscal year, the Company and the major subsidiaries and affiliates invested a total 245,908 million yen
on a number of initiatives, such as new model production, production volume increase, rationalization, R&D for new
models and technical innovation, distribution, sales channel and IT related investments. These costs were covered
by retained earnings.
Planned capital expenditure spending for the next fiscal year is 260,000 million yen, mainly from our own funds,
but we shall also select proper financial sources depending on the circumstances.
3. Significant accounting policies
For information regarding significant accounting policies, please refer to the Notes to Consolidated Financial
Statements.
FINANCIAL REVIEW
25