Suzuki 2006 Annual Report Download - page 27
Download and view the complete annual report
Please find page 27 of the 2006 Suzuki annual report below. You can navigate through the pages in the report by either clicking on the pages listed below, or by using the keyword search tool below to find specific information within the annual report.-
 1
1 -
2
-
3
-
4
-
5
-
6
-
7
-
8
-
9
-
10
-
11
-
12
-
13
-
14
-
15
-
16
-
 17
17 -
 18
18 -
 19
19 -
 20
20 -
 21
21 -
 22
22 -
 23
23 -
 24
24 -
 25
25 -
 26
26 -
 27
27 -
 28
28 -
 29
29 -
 30
30 -
 31
31 -
 32
32 -
 33
33 -
 34
34 -
 35
35 -
 36
36 -
 37
37 -
38
-
39
-
40
-
41
-
42
-
43
-
44
-
45
-
46
-
47
-
48
-
49
-
50
-
51
-
52
-
53
 |
 |

SUZUKI MOTOR CORPORATION
Years ended March 31 2006 2005 2004 2003 2002 2006
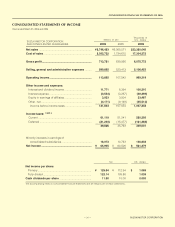
Net sales ............................... ¥2,746,453 ¥2,365,571 ¥2,198,986 ¥2,015,309 ¥1,668,251 $23,380,045
Net income ............................ 65,945 60,506 43,835 31,024 22,392 561,379
Net income per share:
Primary .............................. 125.64 112.94 81.38 57.29 41.40 1.069
Fully diluted ....................... 122.14 109.86 79.17 55.57 41.16 1.039
Cash dividends per share..... 11.00 10.00 9.00 9.00 8.50 0.093
Shareholders’ equity ............. 616,770 745,016 692,345 648,357 620,004 5,250,451
Total current assets............... 1,067,709 999,887 902,263 844,577 773,040 9,089,213
Total assets ........................... 1,849,714 1,693,353 1,577,709 1,537,430 1,347,718 15,746,271
Depreciation and amortization
126,520 97,731 87,858 83,896 75,083 1,077,047
SUZUKI MOTOR CORPORATION
CONSOLIDATED
NON-CONSOLIDATED
Thousands of
U.S. dollars
(except per
share amounts)
Years ended March 31 2006 2005 2004 2003 2002 2006
Net sales ............................... ¥1,690,169 ¥1,481,632 ¥1,392,688 ¥1,411,418 ¥1,320,218 $14,388,092
Net income ............................ 37,271 35,747 25,650 19,393 13,912 317,282
Net income per share:
Primary .............................. 70.78 66.56 47.46 35.67 25.72 0.602
Fully diluted ....................... 68.82 64.75 46.17 34.61 25.59 0.585
Cash dividends per share..... 11.00 10.00 9.00 9.00 8.50 0.093
Shareholders’ equity ............. 364,127 540,890 518,198 483,670 477,053 3,099,747
Total current assets............... 518,728 589,848 519,025 539,322 564,830 4,415,836
Total assets ........................... 1,082,344 1,098,073 1,039,261 1,070,708 1,028,709 9,213,791
Depreciation and amortization
59,362 47,213 47,836 53,578 54,194 505,342
Note: Yen amounts are translated into U.S. dollars for convenience only, at
¥
117.47 = US$1, the prevailing exchange rate as of March 31, 2006.
Calculation of net income per share is made on the adjusted net income basis that bonuses paid to directors and corporate auditors and the
payment of dividends to shareholders of preferred stocks are excluded from net income shown in the income statements from the year of 2003 in
accordance with the revision of regulations of financial statements. The figures for 2002 is not restated.
Millions of yen
(except per share amounts)
Thousands of
U.S. dollars
(except per
share amounts)
Millions of yen
(except per share amounts)
FIVE-YEAR SUMMARY
27