Square Enix 2007 Annual Report Download - page 6
Download and view the complete annual report
Please find page 6 of the 2007 Square Enix annual report below. You can navigate through the pages in the report by either clicking on the pages listed below, or by using the keyword search tool below to find specific information within the annual report.-
 1
1 -
 2
2 -
 3
3 -
 4
4 -
 5
5 -
 6
6 -
 7
7 -
 8
8 -
 9
9 -
 10
10 -
 11
11 -
 12
12 -
 13
13 -
 14
14 -
 15
15 -
 16
16 -
 17
17 -
18
-
19
-
20
-
21
-
22
-
23
-
24
-
25
-
26
-
27
-
28
-
29
-
30
-
31
-
32
-
33
-
34
-
35
-
36
-
37
-
38
-
39
-
40
-
41
-
42
-
43
-
44
-
45
-
46
-
47
-
48
-
49
-
50
-
51
-
52
-
53
-
54
-
55
-
56
 |
 |

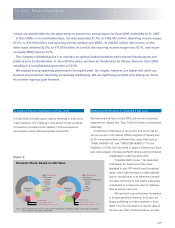
those of catalogue titles due to our improved ability to fulfill
repeat orders. As a result, we succeeded in fully capturing
market opportunities in game software for current-generation
game consoles.
For next-generation game consoles, it become important to
select appropriate region, customer segment and timing based
on careful analysis, as opposed to the wining strategy for the
current generation of selecting and concentrating on the wining
game console.
Next-generation game consoles take networked environ-
ments as a given, and offer attractive high-definition (HD) graphics
capability as their selling point. The flip side, of course, is that
these consoles cannot be enjoyed in full unless they are networked
and viewed with HD displays. Handheld game devices, on the
other hand, are self-sufficient and have no particular environment
requirements. Consequently, we expected that the next
generation handheld game devices would penetrate the market
ahead of the next generation consoles in fiscal 2006 and fiscal
2007, and adjusted development resources accordingly.
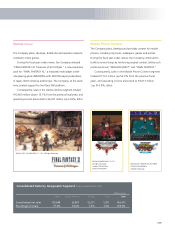
Examples of our success with this approach in Japan include
sales of the totally remade “FINAL FANTASY III”, which sold
990,000 copies in Japan and 460,000 copies in North America;
and “Dragon Quest Monsters: Joker”, which sold 1.41 million
copies in Japan. Both titles were developed for Nintendo Co.,
Ltd.’s new handheld game device, NINTENDO DS, and played a
major role in our success. Our decision to utilize Nintendo Wi-Fi
connection in “Dragon Quest Monsters: Joker” proved to be
extremely popular, with over 5.6 million cumulative online
accesses, proving new market potential.
This strategy is for the transition period, of course, and we
have no intention of relying solely on handheld game devices in
the future. In fact, over the next few years we aim to put our
resources in research and development of cutting edge tech-
nologies in the next generation consoles and personal computer
(PC). We will also work on improving our development pipelines
to achieve more efficient and flexible game development. For
that purpose, we created the Research and Development
Division as a permanent organization in fiscal 2006, in a
departure from our previous project-based R&D activities.
In the Games (Online) segment, we are continuing to raise
the bar on profits each year. In fiscal 2006, we maintained a
profit margin of 49.5%, which is extremely high. A high
dependency on “FINAL FANTASY XI” is one of our weaknesses
in this business, but in fiscal 2006 we set the stage to move on
to the next generation of games.
In the Mobile Phone Content business, we cleared our profit
target and posted a new record, but our overseas expansion fell
short of expectations. It is becoming apparent that the mobile
phone markets in overseas develop very differently from
Japanese one. We need to calibrate our strategy accordingly.
In the Publication segment, we achieved the highest levels of
sales and profits that we have seen since the days of the former
ENIX. Rather than relying on a single hit product, we acquired
the ability to generate a constant stream of hits, and our strategy
of taking our content across diverse media including, periodicals,
anime titles and comic books, is proving to be effective.
04
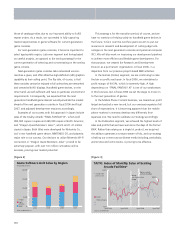
Game Software Unit Sales by Region
■ Europe
■ North
America
■ Japan
Thousands of Units
Years ended March 31
2007200620052004
0
5,000
10,000
15,000
20,000
[Figure 2]
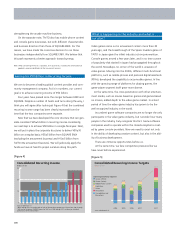
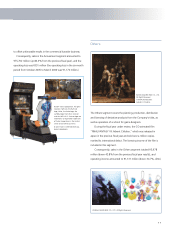
TAITO: Index of Monthly Sales of Existing
Arcade Facilities*
Source: SQUARE ENIX
■ TAITO
Other company
Became wholly
owned subsidiary
TAITO
April 2007April 2006April 2005April 2004
75%
100%
125%
Joined
the SQUARE ENIX
Group
* Change from
previous year
[Figure 3]
#H2-14-07スクエニ-欧文 07.8.31 14:26 ページ4