Square Enix 2007 Annual Report Download - page 21
Download and view the complete annual report
Please find page 21 of the 2007 Square Enix annual report below. You can navigate through the pages in the report by either clicking on the pages listed below, or by using the keyword search tool below to find specific information within the annual report.-
 1
1 -
2
-
3
-
4
-
5
-
6
-
7
-
8
-
9
-
10
-
 11
11 -
 12
12 -
 13
13 -
 14
14 -
 15
15 -
 16
16 -
 17
17 -
 18
18 -
 19
19 -
 20
20 -
 21
21 -
 22
22 -
 23
23 -
 24
24 -
 25
25 -
 26
26 -
 27
27 -
 28
28 -
 29
29 -
 30
30 -
 31
31 -
32
-
33
-
34
-
35
-
36
-
37
-
38
-
39
-
40
-
41
-
42
-
43
-
44
-
45
-
46
-
47
-
48
-
49
-
50
-
51
-
52
-
53
-
54
-
55
-
56
 |
 |

19
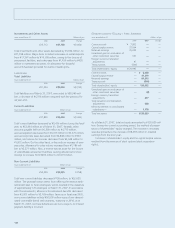
Consolidated Statements of Income
Net Sales and Operating Income
Years ended March 31 Millions of yen
2006 Composition 2007 Composition Amount change Percent change
Net sales ¥124,473 100.0% ¥163,472 100.0% ¥38,999 31.3%
Gross profit 56,367 45.3 76,210 46.6 19,843 35.2
Reversal of allowance for
sales returns 1,316 1.1 1,186 0.8 (129) (9.8)
Provision for allowance for
sales returns 1,186 1.0 2,271 1.4 1,084 91.4
Net gross profit 56,497 45.4 75,125 46.0 18,628 33.0
Selling, general and
administrative expenses 41,026 33.0 49,209 30.1 8,182 19.9
Operating income 15,470 12.4 25,916 15.9 10,446 67.5
Comparisons by segment against the preceding fiscal year are provided in the section describing operating performance on pages 8-11.
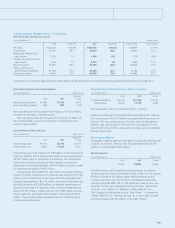
Non-Operating Income and Expenses
Years ended March 31 Millions of yen
Reference:
2006 2007 Change
Non-operating income ¥1,046 ¥1,176 ¥130
Non-operating expenses 968 852 (116)
Non-operating income increased ¥130 million, to ¥1,176 million,
owing to an increase in interest income.
Non-operating expenses decreased ¥116 million, to ¥852 mil-
lion. In fiscal 2006, no loss on write-off of content production
account was recorded.
Extraordinary Gain and Loss
Years ended March 31 Millions of yen
Reference:
2006 2007 Change
Extraordinary gain ¥1,361 ¥3,778 ¥2,417
Extraordinary loss 7,878 11,629 3,751
Extraordinary gain amounted to ¥3,778 million. In the Amusement
segment, disposal of the commercial karaoke business generated a
¥2,697 million gain on divestiture of a business. The introduction
of an early retirement program at Taito resulted in reversal of
allowance for retirement benefits of ¥465 million, and gain on sale
of investment securities of ¥410 million.
Extraordinary loss totaled ¥11,629 million as a result of the fol-
lowing: provision of allowance for game arcade closings of ¥2,784
million, loss on disposal and write-down of assets associated with
business restructuring of ¥2,275 million, provision of allowance for
doubtful accounts of ¥2,086 million, accelerated amortization of
goodwill in line with the disposal of the commercial karaoke busi-
ness of ¥1,831 million, impairment loss of ¥1,085 million and sev-
erance payments associated with business restructuring of ¥925
million. These factors sprang primarily from the restructuring of
the Amusement business.
Capital Expenditures and Depreciation
Years ended March 31 Millions of yen
2006 2007 Change
Capital expenditures ¥9,169 ¥11,360 ¥2,191
Depreciation 8,419 11,115 2,696
Note: Depreciation does not include amortization of goodwill.
Capital expenditures for the fiscal 2006 amounted to ¥11,360 mil-
lion, an increase of ¥2,191 million compared with the previous fis-
cal year. This was mainly owing to the fact that the Amusement
business was only included in the scope of consolidation for the
second half of fiscal 2005, whereas the business was consolidated
through fiscal 2006.
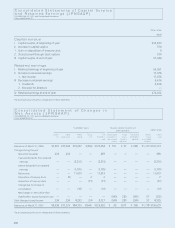
Overseas Sales
Geographic segment sales are dependent on game title development
in Japan. As a result, overseas sales fluctuate depending on the
timing of overseas game title releases.
North America
Years ended March 31 Millions of yen
2006 2007 Change
15,635 23,801 8,166
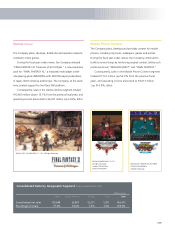
In North America, the Company’s main businesses are Games
(Offline), Games (Online) and Mobile Phone Content. In the Games
(Offline) business in this region, game titles developed by the
Company are sold under license from consolidated subsidiaries,
mainly by SQUARE ENIX, INC. In the fiscal year under review, sev-
eral titles for PS2 were released, including the titles “FINAL FAN-
TASY XII” and “DIRGE OF CERBERUS –FINAL FANTASY VII–.”
The Company’s online game service “Play Online” —focused on
“FINAL FANTASY XI”—performed well. As a result, sales in North
America increased ¥8,166 million, to ¥23,801 million.
15-52_07スクエニ欧文 07.8.31 14:29 ページ19