Square Enix 2007 Annual Report Download - page 49
Download and view the complete annual report
Please find page 49 of the 2007 Square Enix annual report below. You can navigate through the pages in the report by either clicking on the pages listed below, or by using the keyword search tool below to find specific information within the annual report.-
 1
1 -
2
-
3
-
4
-
5
-
6
-
7
-
8
-
9
-
10
-
11
-
12
-
13
-
14
-
15
-
16
-
17
-
18
-
19
-
20
-
21
-
22
-
23
-
24
-
25
-
26
-
27
-
28
-
29
-
30
-
31
-
32
-
33
-
34
-
35
-
36
-
37
-
38
-
 39
39 -
 40
40 -
 41
41 -
 42
42 -
 43
43 -
 44
44 -
 45
45 -
 46
46 -
 47
47 -
 48
48 -
 49
49 -
 50
50 -
 51
51 -
 52
52 -
 53
53 -
 54
54 -
 55
55 -
 56
56
 |
 |

47
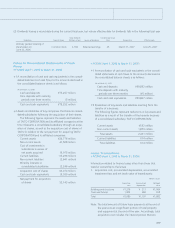
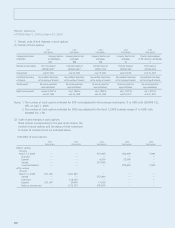
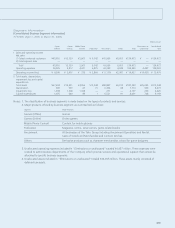
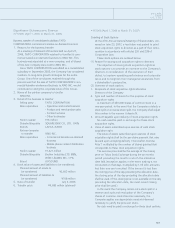
[Consolidated Geographic Segment Information]
• FY2005 (April 1, 2005 to March 31, 2006)
Millions of yen
North Eliminations or Consolidated
Japan America Europe Asia Total unallocated total
I Sales and operating income
Net sales
(1) Sales to external customers ¥107,354 ¥14,670 ¥ 413 ¥2,035 ¥124,473 ¥— ¥124,473
(2) Intersegment sales 4,316 837 364 5 5,523 (5,523) —
Total 111,670 15,507 778 2,040 129,997 (5,523) 124,473
Operating expenses 99,910 12,109 728 1,778 114,526 (5,523) 109,003
Operating income ¥ 11,760 ¥ 3,398 ¥ 49 ¥ 262 ¥ 15,470 ¥— ¥ 15,470
II Total assets ¥196,210 ¥12,683 ¥1,207 ¥3,247 ¥213,348 ¥— ¥213,348
Notes: 1. The classification of geographic segments is made based on geographical distance.
2. Main countries included in each segment:
(1) North America..............the United States of America
(2) Europe .........................United Kingdom
(3) Asia..............................China, Korea
3. There were no unallocated operating expenses included in “Eliminations or unallocated.”
4. There were no unallocated assets included in “Eliminations or unallocated.”
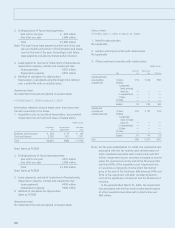
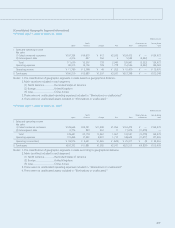
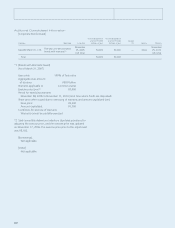
• FY2006 (April 1, 2006 to March 31, 2007)
Millions of yen
North Eliminations or Consolidated
Japan America Europe Asia Total unallocated total
I Sales and operating income
Net sales
(1) Sales to external customers ¥128,665 ¥22,341 ¥11,409 ¥1,056 ¥163,472 ¥— ¥163,472
(2) Intersegment sales 9,776 833 457 11 11,078 (11,078) —
Total 138,441 23,174 11,867 1,067 174,551 (11,078) 163,472
Operating expenses 119,465 17,552 9,901 1,713 148,633 (11,077) 137,555
Operating income (loss) ¥ 18,976 ¥ 5,621 ¥1,965 ¥ (645) ¥ 25,917 ¥(0) ¥ 25,916
II Total assets ¥203,303 ¥11,881 ¥7,585 ¥2,747 ¥225,517 ¥(9,838) ¥215,679
Notes: 1. The classification of geographic segments is made according to geographical distance.
2. Main countries included in each segment:
(1) North America..............the United States of America
(2) Europe .........................United Kingdom
(3) Asia..............................China, Korea
3. There were no unallocated operating expenses included in “Eliminations or unallocated.”
4. There were no unallocated assets included in “Eliminations or unallocated.”
15-52_07スクエニ欧文 07.8.31 14:29 ページ47