Shutterfly 2012 Annual Report Download - page 57
Download and view the complete annual report
Please find page 57 of the 2012 Shutterfly annual report below. You can navigate through the pages in the report by either clicking on the pages listed below, or by using the keyword search tool below to find specific information within the annual report.-
 1
1 -
2
-
3
-
4
-
5
-
6
-
7
-
8
-
9
-
10
-
11
-
12
-
13
-
14
-
15
-
16
-
17
-
18
-
19
-
20
-
21
-
22
-
23
-
24
-
25
-
26
-
27
-
28
-
29
-
30
-
31
-
32
-
33
-
34
-
35
-
36
-
37
-
38
-
39
-
40
-
41
-
42
-
43
-
44
-
45
-
46
-
 47
47 -
 48
48 -
 49
49 -
 50
50 -
 51
51 -
 52
52 -
 53
53 -
 54
54 -
 55
55 -
 56
56 -
 57
57 -
 58
58 -
 59
59 -
 60
60 -
 61
61 -
 62
62 -
 63
63 -
 64
64 -
 65
65 -
 66
66 -
 67
67 -
68
-
69
-
70
-
71
-
72
-
73
-
74
-
75
-
76
-
77
-
78
-
79
-
80
-
81
-
82
-
83
-
84
-
85
-
86
-
87
-
88
-
89
-
90
-
91
-
92
-
93
-
94
-
95
-
96
-
97
-
98
-
99
-
100
-
101
-
102
-
103
-
104
-
105
-
106
 |
 |

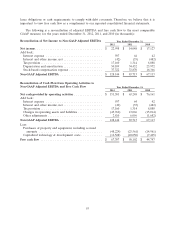
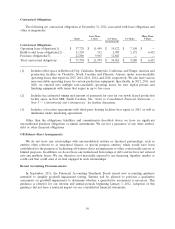
lease obligations or cash requirements to comply with debt covenants. Therefore, we believe that it is
important to view free cash flow as a complement to our reported consolidated financial statements.
The following is a reconciliation of adjusted EBITDA and free cash flow to the most comparable
GAAP measure, for the years ended December 31, 2012, 2011, and 2010 (in thousands):
Reconciliation of Net Income to Non-GAAP Adjusted EBITDA Year Ended December 31,
2012 2011 2010
Net income ...................................... $ 22,998 $ 14,048 $ 17,127
Add back:
Interest expense ................................ 597 64 42
Interest and other income, net ...................... (42) (35) (482)
Tax provision ................................... 17,160 1,314 8,088
Depreciation and amortization ...................... 50,109 34,452 25,972
Stock-based compensation expense ................... 37,322 33,870 16,366
Non-GAAP Adjusted EBITDA ........................ $ 128,144 $ 83,713 $ 67,113
Reconciliation of Cash Flow from Operating Activities to
Non-GAAP Adjusted EBITDA and Free Cash Flow Year Ended December 31,
2012 2011 2010
Net cash provided by operating activities ................ $ 151,381 $ 63,248 $ 76,161
Add back:
Interest expense ................................ 597 64 42
Interest and other income, net ...................... (42) (35) (482)
Tax provision ................................... 17,160 1,314 8,088
Changes in operating assets and liabilities .............. (43,762) 13,066 (15,014)
Other adjustments ............................... 2,810 6,056 (1,682)
Non-GAAP Adjusted EBITDA ........................ 128,144 83,713 67,113
Less:
Purchases of property and equipment, including accrued
amounts .................................... (48,229) (23,561) (14,961)
Capitalized technology & development costs ............ (12,528) (10,050) (7,405)
Free cash flow ................................... $ 67,387 $ 50,102 $ 44,747
55