Shutterfly 2012 Annual Report Download - page 53
Download and view the complete annual report
Please find page 53 of the 2012 Shutterfly annual report below. You can navigate through the pages in the report by either clicking on the pages listed below, or by using the keyword search tool below to find specific information within the annual report.-
 1
1 -
2
-
3
-
4
-
5
-
6
-
7
-
8
-
9
-
10
-
11
-
12
-
13
-
14
-
15
-
16
-
17
-
18
-
19
-
20
-
21
-
22
-
23
-
24
-
25
-
26
-
27
-
28
-
29
-
30
-
31
-
32
-
33
-
34
-
35
-
36
-
37
-
38
-
39
-
40
-
41
-
42
-
 43
43 -
 44
44 -
 45
45 -
 46
46 -
 47
47 -
 48
48 -
 49
49 -
 50
50 -
 51
51 -
 52
52 -
 53
53 -
 54
54 -
 55
55 -
 56
56 -
 57
57 -
 58
58 -
 59
59 -
 60
60 -
 61
61 -
 62
62 -
 63
63 -
64
-
65
-
66
-
67
-
68
-
69
-
70
-
71
-
72
-
73
-
74
-
75
-
76
-
77
-
78
-
79
-
80
-
81
-
82
-
83
-
84
-
85
-
86
-
87
-
88
-
89
-
90
-
91
-
92
-
93
-
94
-
95
-
96
-
97
-
98
-
99
-
100
-
101
-
102
-
103
-
104
-
105
-
106
 |
 |

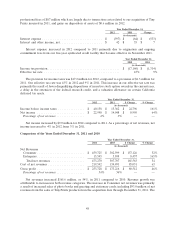
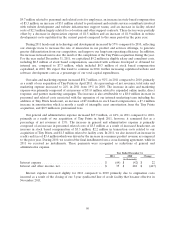
Interest and other income, net decreased by $0.5 million for 2011 compared to 2010. The decrease was
primarily due to the liquidation of our ARS investments on July 1, 2010, which yielded higher returns and
were subsequently invested in Treasury securities, which yielded lower returns.
Year Ended December 31,
2011 2010
(in thousands)
Income tax provision ......................................... $ (1,314) $ (8,088)
Effective tax rate ........................................... 9% 32%
The provision for income taxes was $1.3 million for 2011, compared to a provision of $8.1 million for
2010. Our effective tax rate was 9% in 2011, down from 32% in 2010. This decrease in our effective tax rate
is primarily the result of disqualifying dispositions of incentive stock option awards largely related to
assumed Tiny Prints options and from Research and Development tax credits.
At December 31, 2011, we had approximately $41.1 million, $55.1 million, and $20.3 million of federal,
California, and other state jurisdictions net operating loss carryforwards, respectively, to reduce future
taxable income, $39.5 million, $29.9 million and $20.3 million of which is associated with windfall tax
benefits, respectively, that will be recorded as additional paid-in capital when realized. These carryforwards
will expire beginning in the year 2028 and 2013 for federal and California purposes, respectively, and no
sooner than 2022 for the portion related to 15 other state jurisdictions, if not utilized.
Year Ended December 31,
2011 2010 $ Change % Change
(in thousands)
Income before income taxes ............... $ 15,362 $ 25,215 $ (9,853) (39)%
Net income ........................... $ 14,048 $ 17,127 $ (3,079) (18)%
Percentage of net revenues ................ 3% 6% — —
Net income decreased by $3.1 million, or 18%, from 2010 to 2011. As a percentage of net revenue, net
income was 3% of net revenue for 2011 compared to 6% for 2010.
Liquidity and Capital Resources
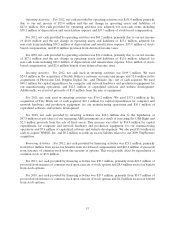
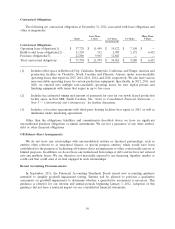
At December 31, 2012, we had $245.1 million of cash and cash equivalents. In addition, to supplement
our overall liquidity position, we entered into a five-year senior secured syndicated credit facility in
November 2011 to provide up to $125.0 million in additional capital resources. In addition, we may request
to increase the credit facility by $75.0 million. As of December 31, 2012, no amounts have been drawn
against this facility.
51