Shutterfly 2012 Annual Report Download - page 49
Download and view the complete annual report
Please find page 49 of the 2012 Shutterfly annual report below. You can navigate through the pages in the report by either clicking on the pages listed below, or by using the keyword search tool below to find specific information within the annual report.-
 1
1 -
2
-
3
-
4
-
5
-
6
-
7
-
8
-
9
-
10
-
11
-
12
-
13
-
14
-
15
-
16
-
17
-
18
-
19
-
20
-
21
-
22
-
23
-
24
-
25
-
26
-
27
-
28
-
29
-
30
-
31
-
32
-
33
-
34
-
35
-
36
-
37
-
38
-
 39
39 -
 40
40 -
 41
41 -
 42
42 -
 43
43 -
 44
44 -
 45
45 -
 46
46 -
 47
47 -
 48
48 -
 49
49 -
 50
50 -
 51
51 -
 52
52 -
 53
53 -
 54
54 -
 55
55 -
 56
56 -
 57
57 -
 58
58 -
 59
59 -
60
-
61
-
62
-
63
-
64
-
65
-
66
-
67
-
68
-
69
-
70
-
71
-
72
-
73
-
74
-
75
-
76
-
77
-
78
-
79
-
80
-
81
-
82
-
83
-
84
-
85
-
86
-
87
-
88
-
89
-
90
-
91
-
92
-
93
-
94
-
95
-
96
-
97
-
98
-
99
-
100
-
101
-
102
-
103
-
104
-
105
-
106
 |
 |

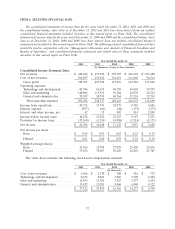
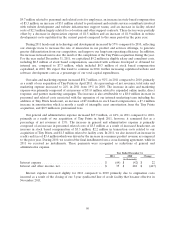
percentage was benefited by scale efficiencies, but offset by increased volumes of lower margin Enterprise
sales.
Year Ended December 31,
2012 2011 $ Change % Change
(in thousands)
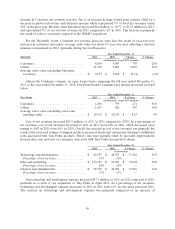
Technology and development ............... $ 85,746 $ 65,675 $ 20,071 31%
Percentage of net revenues ................ 13% 14% — —
Sales and marketing ..................... $ 148,806 $ 113,952 $ 34,854 31%
Percentage of net revenues ................ 23% 24% — —
General and administrative ................ $ 70,502 $ 58,710 $ 11,792 20%
Percentage of net revenues ................ 11% 13% — —
Our technology and development expense increased $20.1 million, or 31%, in 2012, compared to 2011.
As a percentage of net revenues, technology and development expense decreased to 13% in 2012 from
14% in 2011. The increase in technology and development expense was primarily due to an increase of
$10.9 million related to personnel and related costs, reflecting additional hires during 2012, as well as the
inclusion of the Tiny Prints development team for the entire year 2012. There was also an increase of
$5.6 million related to incremental costs associated with our acquisition of Photoccino and Kodak Gallery’s
accounts. The overall increase was also due to an increase of $3.5 million in depreciation expense, an
increase of $2.2 million in professional fees, and an increase of $0.8 million in stock based compensation.
These factors were partially offset by an increase of $3.1 million in website development costs capitalized
in the current period compared to the same period in the prior year.
During 2012, headcount in technology and development increased by 24% compared to 2011,
reflecting our strategic focus to increase the rate of innovation in our product and services offerings, to
generate greater differentiation from our competitors, and improve our long-term operating efficiency. In
2012, we capitalized $12.4 million in eligible salary and consultant costs, including $0.9 million of stock-
based compensation, associated with software developed or obtained for internal use, compared to
$9.2 million, which included $0.5 million of stock-based compensation capitalized in 2011.
Our sales and marketing expense increased $34.9 million, or 31%, in 2012 compared to 2011. As a
percentage of net revenues, total sales and marketing expense decreased to 23% in 2012 from 24% in 2011.
The increase in sales and marketing expense was primarily due to an increase of $18.1 million related to
direct response, expanded online and performance marketing campaigns, and TV advertising, such as our
first national cable TV campaign. The increase is also attributable to an increase of $9.2 million in
personnel and related costs associated with the expansion of our internal marketing team and an increase
of $7.0 million in intangible asset amortization primarily from the Kodak Gallery customer list and a full
year of intangible asset amortization from the Tiny Prints acquisition.
Our general and administrative expense increased $11.8 million, or 20%, in 2012 compared to 2011. As
a percentage of net revenues, general and administrative expense decreased to 11% in 2012 from 13% for
2011. The increase in general and administrative expense is primarily due to an increase in personnel
related costs of $4.5 million and an increase in stock-based compensation of $3.3 million as a result of
increased headcount. There was also an increase in credit card fees of $3.2 million which was driven by the
increase in Consumer net revenues as compared to the prior year, an increase in depreciation of
$0.8 million, and an increase in facilities of $0.8 million. The increases were partially offset by a decrease in
47