Shutterfly 2012 Annual Report Download - page 51
Download and view the complete annual report
Please find page 51 of the 2012 Shutterfly annual report below. You can navigate through the pages in the report by either clicking on the pages listed below, or by using the keyword search tool below to find specific information within the annual report.-
 1
1 -
2
-
3
-
4
-
5
-
6
-
7
-
8
-
9
-
10
-
11
-
12
-
13
-
14
-
15
-
16
-
17
-
18
-
19
-
20
-
21
-
22
-
23
-
24
-
25
-
26
-
27
-
28
-
29
-
30
-
31
-
32
-
33
-
34
-
35
-
36
-
37
-
38
-
39
-
40
-
 41
41 -
 42
42 -
 43
43 -
 44
44 -
 45
45 -
 46
46 -
 47
47 -
 48
48 -
 49
49 -
 50
50 -
 51
51 -
 52
52 -
 53
53 -
 54
54 -
 55
55 -
 56
56 -
 57
57 -
 58
58 -
 59
59 -
 60
60 -
 61
61 -
62
-
63
-
64
-
65
-
66
-
67
-
68
-
69
-
70
-
71
-
72
-
73
-
74
-
75
-
76
-
77
-
78
-
79
-
80
-
81
-
82
-
83
-
84
-
85
-
86
-
87
-
88
-
89
-
90
-
91
-
92
-
93
-
94
-
95
-
96
-
97
-
98
-
99
-
100
-
101
-
102
-
103
-
104
-
105
-
106
 |
 |

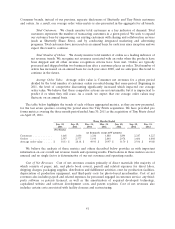
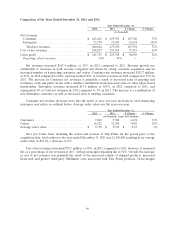
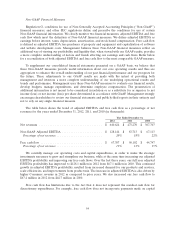
increase in Consumer net revenues was also due to an increase in large format print revenue offset by a
decrease in photocard revenue and 4x6 print revenue which represented 7% of total net revenues versus
10% in the prior year. Revenue from Enterprise increased $8.4 million, or 165%, to $13.5 million for 2011,
and represented 3% of our total net revenues in 2011 compared to 2% in 2010. This increase is primarily
the result of sales to customers acquired in the WMSG acquisition.
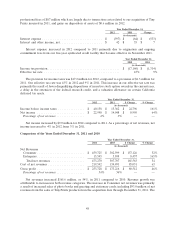
For the Shutterfly brand, Consumer net revenue increases were also the result of year-over-year
increases in customers and orders. Average order value was down 1% year-over-year reflecting a discount
intensive environment in 2011, primarily during the fourth quarter.
Year Ended December 31,
Shutterfly 2011 2010 Change % Change
(in thousands, except AOV amounts)
Customers ............................ 4,864 4,069 795 20%
Orders ............................... 11,259 9,204 2,055 22%
Average order value (excluding Enterprise
revenues) ........................... $ 32.57 $ 32.88 $ (0.31) (1)%
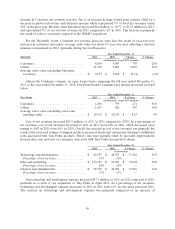
Also in the Consumer category, on a pro forma basis, comparing the full year ended December 31,
2011 to the year ended December 31, 2010, Tiny Prints brand’s Consumer key metrics increased as noted
below:
Year Ended December 31,
Tiny Prints 2011 2010 $ Change % Change
(in thousands, except AOV amounts)
Customers ............................ 1,030 759 271 36%
Orders ............................... 1,417 920 497 54%
Average order value (excluding one-to-one
greeting cards) ....................... $ 110.63 $ 102.40 $ 8.23 8%
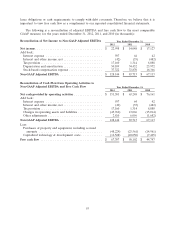
Cost of net revenues increased $85.1 million, or 63%, in 2011 compared to 2010. As a percentage of
net revenues, cost of net revenues increased to 46% in 2011 from 44% in 2010, which decreased gross
margin to 54% in 2011 from 56% in 2010. Overall, the increase in cost of net revenues was primarily the
result of the increased volume of shipped products, increased headcount and greater third-party fulfillment
costs associated with Tiny Prints products. These costs were partially offset by favorable improvements
from product mix and unit cost synergies associated with Tiny Prints incremental volume.
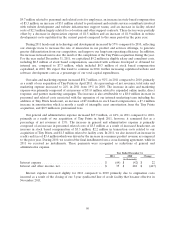
Year Ended December 31,
2011 2010 $ Change % Change
(in thousands)
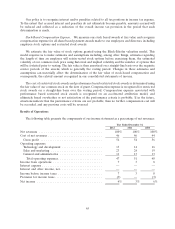
Technology and development ............... $ 65,675 $ 48,393 $ 17,282 36%
Percentage of net revenues ................ 14% 16% — —
Sales and marketing ..................... $ 113,952 $ 59,284 $ 54,668 92%
Percentage of net revenues ................ 24% 19% — —
General and administrative ................ $ 58,710 $ 40,764 $ 17,946 44%
Percentage of net revenues ................ 13% 13% — —
Our technology and development expense increased $17.3 million, or 36%, in 2011 compared to 2010,
primarily as a result of our acquisition of Tiny Prints in April 2011. As a percentage of net revenues,
technology and development expense decreased to 14% in 2011 from 16% for the same period in 2010.
The increase in technology and development expense was primarily composed of an increase of
49