Shutterfly 2012 Annual Report Download - page 55
Download and view the complete annual report
Please find page 55 of the 2012 Shutterfly annual report below. You can navigate through the pages in the report by either clicking on the pages listed below, or by using the keyword search tool below to find specific information within the annual report.-
 1
1 -
2
-
3
-
4
-
5
-
6
-
7
-
8
-
9
-
10
-
11
-
12
-
13
-
14
-
15
-
16
-
17
-
18
-
19
-
20
-
21
-
22
-
23
-
24
-
25
-
26
-
27
-
28
-
29
-
30
-
31
-
32
-
33
-
34
-
35
-
36
-
37
-
38
-
39
-
40
-
41
-
42
-
43
-
44
-
 45
45 -
 46
46 -
 47
47 -
 48
48 -
 49
49 -
 50
50 -
 51
51 -
 52
52 -
 53
53 -
 54
54 -
 55
55 -
 56
56 -
 57
57 -
 58
58 -
 59
59 -
 60
60 -
 61
61 -
 62
62 -
 63
63 -
 64
64 -
 65
65 -
66
-
67
-
68
-
69
-
70
-
71
-
72
-
73
-
74
-
75
-
76
-
77
-
78
-
79
-
80
-
81
-
82
-
83
-
84
-
85
-
86
-
87
-
88
-
89
-
90
-
91
-
92
-
93
-
94
-
95
-
96
-
97
-
98
-
99
-
100
-
101
-
102
-
103
-
104
-
105
-
106
 |
 |
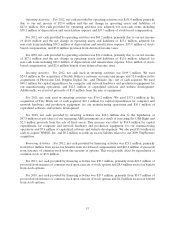
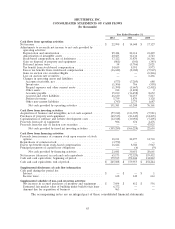
Operating Activities. For 2012, net cash provided by operating activities was $151.4 million, primarily
due to our net income of $23.0 million and the net change in operating assets and liabilities of
$43.8 million. Net cash provided by operating activities was adjusted for non-cash items including
$50.1 million of depreciation and amortization expense and $37.3 million of stock-based compensation.
For 2011, net cash provided by operating activities was $63.2 million, primarily due to our net income
of $14.0 million and the net change in operating assets and liabilities of $13.1 million, adjusted for
non-cash items including $34.5 million of depreciation and amortization expense, $33.9 million of stock-
based compensation, and $5.8 million provision from deferred income taxes.
For 2010, net cash provided by operating activities was $76.2 million, primarily due to our net income
of $17.1 million and the net change in operating assets and liabilities of $15.0 million, adjusted for
non-cash items including $26.0 million of depreciation and amortization expense, $16.4 million of stock-
based compensation, and $2.0 million benefit from deferred income taxes.
Investing Activities. For 2012, net cash used in investing activities was $109.3 million. We used
$24.4 million in the acquisition of Kodak Gallery’s customer accounts and images and 32.8 million in the
acquisitions of Photoccino Ltd, Penguin Digital, Inc., and ThisLife, Inc., net of cash acquired. We used
$40.5 million for capital expenditures for computer and network hardware and production equipment for
our manufacturing operations, and $12.5 million of capitalized software and website development.
Additionally, we received proceeds of $1.0 million from the sale of equipment.
For 2011, net cash used in investing activities was $166.2 million. We used $133.1 million in the
acquisition of Tiny Prints net of cash acquired, $23.1 million for capital expenditures for computer and
network hardware and production equipment for our manufacturing operations and $10.1 million of
capitalized software and website development.
For 2010, net cash provided by investing activities was $22.6 million due to the liquidation of
$47.9 million (at par value) of our remaining ARS investments as a result of exercising the UBS Right and
$2.5 million proceeds from the sale of fixed assets. This increase was offset by $14.4 million for capital
expenditures for computer and network hardware and production equipment for our manufacturing
operations and $7.4 million of capitalized software and website development. We also paid $5.8 million in
cash to acquire WMSG, Inc. and $0.2 million to settle an escrow liability related to our 2009 TinyPictures
acquisition.
Financing Activities. For 2012, net cash provided by financing activities was $23.1 million, primarily
from $16.6 million from excess tax benefits from stock-based compensation and $10.2 million of proceeds
from issuance of common stock from the exercise of options. This was partially offset by repurchases of
common stock of $3.8 million.
For 2011, net cash provided by financing activities was $30.7 million, primarily from $22.3 million of
proceeds from issuance of common stock upon exercise of stock options and $8.4 million excess tax benefit
from stock-options.
For 2010, net cash provided by financing activities was $20.7 million, primarily from $14.7 million of
proceeds from issuance of common stock upon exercise of stock options and $6.0 million excess tax benefit
from stock-options.
53