Ricoh 2014 Annual Report Download - page 19
Download and view the complete annual report
Please find page 19 of the 2014 Ricoh annual report below. You can navigate through the pages in the report by either clicking on the pages listed below, or by using the keyword search tool below to find specific information within the annual report.
Overview Action Data & Prole
Seeking Higher
Corporate Value
Ricoh Group Sustainability Report 2014 18
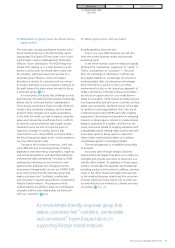
Broadlyspeaking,wehavetwoobjectives.Therst
is to reinforce and develop the protability of core
businesses, which are the current source of prots,
and redirect the prots to cultivate new growth
domains. Specically, we will continue to hone a
sharper competitive edge in the ofce business—
products as well as services—while using
• Net Sales Growth Scenario by Business Segment
Reinforce and develop earnings power for
core businesses
• Achieve an MIF* growth ratio of 2%
• Double ofce business sales for emerging
markets
• Increase sales of IT services and new
product-related sales by 130%
Achieve growth by creating new prot
generators
• Increase sales in the industrial business
domain by 150% in three years
• Launch three or more new businesses worth
10 billion yen for 19th MTP
Ofce
Imaging
Other
■FY14 ■FY17(plan)
CAGR
1%
Production
Printing
CAGR
9%
Network System
Solutions
CAGR
10%
Industrial
Products
CAGR
12%
CAGR
7%
1,600
1,400
400
200
0
Imaging & Solutions
(JPYBillion)
Total net sales
CAGR3%
CAGR (compound annual
growth rate) 4%
communications products and services to present
different workstyles and thereby capture new
business opportunities. The second objective is to
achieve growth by creating new pillars of business,
and we aim to extend greater value to customers
inthe industrial, consumer and public sector and
infrastructure markets. P.21, 27
Business strategy targets
* MIF: Number of MFPs in
operation in the market


