Red Lobster 2002 Annual Report Download - page 45
Download and view the complete annual report
Please find page 45 of the 2002 Red Lobster annual report below. You can navigate through the pages in the report by either clicking on the pages listed below, or by using the keyword search tool below to find specific information within the annual report.-
 1
1 -
2
-
3
-
4
-
5
-
6
-
7
-
8
-
9
-
10
-
11
-
12
-
13
-
14
-
15
-
16
-
17
-
18
-
19
-
20
-
21
-
22
-
23
-
24
-
25
-
26
-
27
-
28
-
29
-
30
-
31
-
32
-
33
-
34
-
 35
35 -
 36
36 -
 37
37 -
 38
38 -
 39
39 -
 40
40 -
 41
41 -
 42
42 -
 43
43 -
 44
44 -
 45
45 -
 46
46 -
 47
47 -
 48
48 -
 49
49 -
 50
50 -
 51
51 -
 52
52 -
 53
53
 |
 |

DARDEN RESTAURANTS
This is the Bottom Line
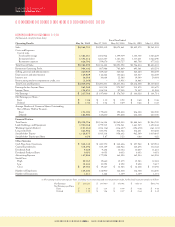
Stock option activity during the periods indicated was as follows:
Weighted-Average Weighted-Average
Options Exercise Price Options Exercise Price
Exercisable Per Share Outstanding Per Share
Balance at May 30, 1999 8,825,661 $7.02 23,249,327 $ 7.57
Options granted 5,591,244 $13.94
Options exercised (1,729,383) $ 6.12
Options cancelled (758,427) $ 8.71
Balance at May 28, 2000 10,068,389 $7.12 26,352,761 $ 8.98
Options granted 5,375,727 $10.99
Options exercised (4,670,100) $ 7.00
Options cancelled (926,100) $10.82
Balance at May 27, 2001 12,222,339 $7.62 26,132,288 $ 9.68
Options granted 5,776,350 $17.36
Options exercised (4,310,327) $ 8.36
Options cancelled (675,776) $13.49
Balance at May 26, 2002 12,152,538 $8.31 26,922,535 $11.44
The following table provides information regarding exercisable and outstanding options as of May 26, 2002:
Weighted-
Weighted- Weighted- Average
Average Average Remaining
Range of Exercise Options Exercise Options Exercise Contractual
Price Per Share Exercisable Price Per Share Outstanding Price Per Share Life (Years)
$ 4.00 - $10.00 8,911,470 7.02 8,933,218 7.02 3.28
$10.01 - $15.00 3,178,559 11.75 12,273,097 11.95 7.28
$15.01 - $20.00 59,461 18.18 5,549,702 17.01 9.15
Over $20.00 3,048 20.45 166,518 25.89 8.55
12,152,538 $ 8.31 26,922,535 $11.44 6.35
The Company granted restricted stock and RSUs during fiscal 2002, 2001, and 2000 totaling 428,280, 563,306 and 336,459
shares, respectively. The per share weighted-average fair value of the awards granted in fiscal 2002, 2001, and 2000 was $17.10,
$10.67, and $13.64, respectively. After giving consideration to assumed forfeiture rates and subsequent forfeiture adjustments,
compensation expense recognized in net earnings for awards granted in fiscal 2002, 2001, and 2000 amounted to $4,392, $4,164,
and $3,314, respectively.
Notes to Consolidated Financial Statements
Great Food and Beverage 42 Produce Great Results in 2002
NOTE 16 EMPLOYEE STOCK PURCHASE PLAN
The Company maintains the Darden Restaurants Employee Stock
Purchase Plan to provide eligible employees who have com-
pleted one year of service an opportunity to purchase shares of
its common stock, subject to certain limitations. Under the plan,
employees may elect to purchase shares at the lower of 85 per-
cent of the fair market value of the Company’s common stock as
of the first or last trading days of each quarterly participation
period. During fiscal 2002, 2001, and 2000, employees purchased
shares of common stock under the plan totaling 284,576,
328,338, and 364,722, respectively. As of May 26, 2002, an
additional 1,039,865 shares are available for issuance.
No compensation expense has been recognized for shares
issued under the plan. The impact of recognizing compensation
expense for purchases made under the plan in accordance
with the fair value method specified in SFAS No. 123 is less
than $200 and has no impact on reported basic or diluted net
earnings per share.