Red Lobster 2002 Annual Report Download - page 31
Download and view the complete annual report
Please find page 31 of the 2002 Red Lobster annual report below. You can navigate through the pages in the report by either clicking on the pages listed below, or by using the keyword search tool below to find specific information within the annual report.-
 1
1 -
2
-
3
-
4
-
5
-
6
-
7
-
8
-
9
-
10
-
11
-
12
-
13
-
14
-
15
-
16
-
17
-
18
-
19
-
20
-
 21
21 -
 22
22 -
 23
23 -
 24
24 -
 25
25 -
 26
26 -
 27
27 -
 28
28 -
 29
29 -
 30
30 -
 31
31 -
 32
32 -
 33
33 -
 34
34 -
 35
35 -
 36
36 -
 37
37 -
 38
38 -
 39
39 -
 40
40 -
 41
41 -
42
-
43
-
44
-
45
-
46
-
47
-
48
-
49
-
50
-
51
-
52
-
53
 |
 |

DARDEN RESTAURANTS
This is the Bottom Line
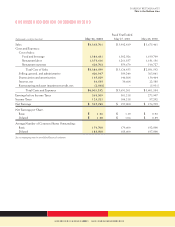
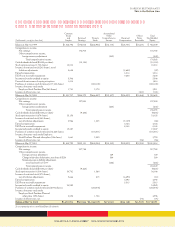
Consolidated Statements of Cash Flows
Fiscal Year Ended
(In thousands) May 26, 2002 May 27, 2001 May 28, 2000
Cash Flows – Operating Activities
Net earnings $ 237,788 $ 197,000 $ 176,705
Adjustments to reconcile net earnings to cash flows:
Depreciation and amortization 165,829 146,864 130,464
Amortization of unearned compensation and
loan costs 7,578 7,031 5,895
Change in current assets and liabilities 49,604 41,740 2,472
Change in other liabilities (619) (642) (371)
Loss on disposal of land, buildings, and equipment 1,803 1,559 2,683
Change in cash surrender value of trust-owned
life insurance 743 ––
Deferred income taxes 22,800 11,750 24,609
Income tax benefits credited to equity 24,989 15,287 5,506
Non-cash restructuring and asset
impairment credit, net (2,568) – (5,931)
Other, net 195 (19) 594
Net Cash Provided by Operating Activities $ 508,142 $ 420,570 $ 342,626
Cash Flows – Investing Activities
Purchases of land, buildings, and equipment (318,392) (355,139) (268,946)
Increase in other assets (24,741) (10,730) (1,820)
Purchase of trust-owned life insurance (31,500) ––
Proceeds from disposal of land, buildings, and equipment
(including net assets held for disposal) 10,741 13,492 20,998
Purchases of short-term investments (9,904) ––
Net Cash Used by Investing Activities $ (373,796) $ (352,377) $ (249,768)
Cash Flows – Financing Activities
Proceeds from issuance of common stock 40,520 36,701 13,944
Dividends paid (9,225) (9,458) (10,134)
Purchases of treasury stock (208,578) (176,511) (202,105)
ESOP note receivable repayments 5,315 8,145 7,600
(Decrease) increase in short-term debt (12,000) (103,000) 91,500
Proceeds from issuance of long-term debt 149,655 224,454 –
Repayment of long-term debt (7,962) (10,658) (9,986)
Payment of loan costs (1,010) (2,154) (349)
Proceeds from issuance of equity put options –– 1,814
Net Cash Used by Financing Activities $ (43,285) $ (32,481) $ (107,716)
Increase (Decrease) in Cash and Cash Equivalents 91,061 35,712 (14,858)
Cash and Cash Equivalents - Beginning of Year 61,814 26,102 40,960
Cash and Cash Equivalents - End of Year $ 152,875 $ 61,814 $ 26,102
Cash Flow from Changes in Current Assets and Liabilities
Receivables 3,781 (4,908) (7,706)
Inventories (23,984) (6,242) (1,485)
Prepaid expenses and other current assets 1,987 (289) (4,184)
Accounts payable 3,205 16,372 (4,238)
Accrued payroll 5,348 4,783 3,540
Accrued income taxes 20,806 14,442 16,712
Other accrued taxes 3,045 1,905 (441)
Other current liabilities 35,416 15,677 274
Change in Current Assets and Liabilities $ 49,604 $ 41,740 $ 2,472
See accompanying notes to consolidated financial statements.
Great Food and Beverage 28 Produce Great Results in 2002