Red Lobster 2002 Annual Report Download - page 21
Download and view the complete annual report
Please find page 21 of the 2002 Red Lobster annual report below. You can navigate through the pages in the report by either clicking on the pages listed below, or by using the keyword search tool below to find specific information within the annual report.-
 1
1 -
2
-
3
-
4
-
5
-
6
-
7
-
8
-
9
-
10
-
 11
11 -
 12
12 -
 13
13 -
 14
14 -
 15
15 -
 16
16 -
 17
17 -
 18
18 -
 19
19 -
 20
20 -
 21
21 -
 22
22 -
 23
23 -
 24
24 -
 25
25 -
 26
26 -
 27
27 -
 28
28 -
 29
29 -
 30
30 -
 31
31 -
32
-
33
-
34
-
35
-
36
-
37
-
38
-
39
-
40
-
41
-
42
-
43
-
44
-
45
-
46
-
47
-
48
-
49
-
50
-
51
-
52
-
53
 |
 |

This discussion and analysis should be read in conjunction with
the Company’s consolidated financial statements and related
notes found elsewhere in this report.
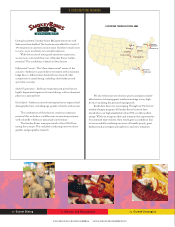
As of May 26, 2002, Darden Restaurants, Inc. (Darden
or the Company) operated 1,211 Red Lobster, Olive Garden,
Bahama Breeze, and Smokey Bones BBQ Sports Bar restau-
rants in the United States and Canada and licensed 33 restau-
rants in Japan. All of the restaurants in the U.S. and Canada
are operated by the Company with no franchising. Darden’s
fiscal year ends on the last Sunday in May. Fiscal 2002, 2001,
and 2000 each consisted of 52 weeks of operation.
On March 21, 2002, the Company’s Board of Directors
declared a three-for-two stock split of the Company’s common
stock. The stock split was effected in the form of a 50 percent
stock dividend which was distributed to stockholders on May
1, 2002, for all stockholders of record as of the close of busi-
ness April 10, 2002. All applicable references to number of
shares and per share amounts of common stock have been
adjusted to reflect the stock split.
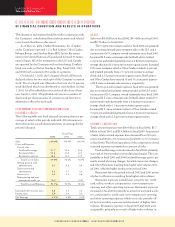
Results of Operations for Fiscal 2002,
2001, and 2000
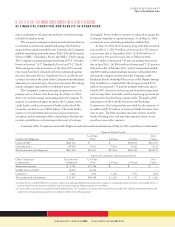
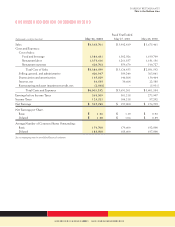
The following table sets forth selected operating data as a per-
centage of sales for the periods indicated. All information is
derived from the consolidated statements of earnings for the
periods indicated.
Fiscal Years
2002 2001 2000
Sales 100.0% 100.0% 100.0%
Costs and Expenses:
Cost of sales:
Food and beverage 31.7 32.6 32.6
Restaurant labor 31.4 31.6 32.2
Restaurant expenses 14.4 14.0 13.9
Total Cost of Sales 77.5% 78.2% 78.7%
Selling, general, and
administrative 9.7 9.8 9.9
Depreciation and
amortization 3.8 3.7 3.6
Interest, net 0.8 0.8 0.6
Restructuring and asset
impairment credit, net (0.1) – (0.2)
Total Costs and Expenses 91.7% 92.5% 92.6%
Earnings before income taxes 8.3 7.5 7.4
Income taxes 2.9 2.6 2.6
Net Earnings 5.4% 4.9% 4.8%
Sales
Sales were $4.4 billion in fiscal 2002, $4.0 billion in fiscal 2001,
and $3.7 billion in fiscal 2000.
The 9.4 percent increase in sales for fiscal 2002 was primarily
due to increased annual same-restaurant sales in the U.S. and a
net increase of 43 Company-owned restaurants since fiscal 2001.
Increased U.S. same-restaurant sales for Red Lobster totaled
6.2 percent and resulted primarily from a 2.8 percent increase in
average check and a 3.4 percent increase in guest counts. Increased
U.S. same-restaurant sales for Olive Garden totaled 6.3 percent
and resulted primarily from a 3.1 percent increase in average
check and a 3.2 percent increase in guest counts. Red Lobster
and Olive Garden have enjoyed 18 and 31 consecutive quarters
of U.S. same-restaurant sales increases, respectively.
The 8.6 percent increase in sales for fiscal 2001 was primarily
due to increased annual same-restaurant sales in the U.S. and a
net increase of 29 Company-owned restaurants since fiscal 2000.
Increased U.S. same-restaurant sales for Red Lobster totaled 5.9
percent and resulted primarily from a 4.8 percent increase in
average check and a 1.1 percent increase in guest counts.
Increased U.S. same-restaurant sales for Olive Garden totaled
7.2 percent and resulted primarily from a 4.9 percent increase in
average check and a 2.3 percent increase in guest counts.
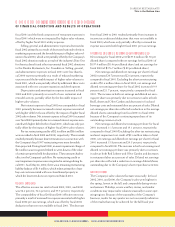
Costs and Expenses
Total costs and expenses were $4.0 billion in fiscal 2002, $3.7
billion in fiscal 2001, and $3.4 billion in fiscal 2000. As a percent
of sales, total costs and expenses have decreased from 92.6 per-
cent in fiscal 2000 to 92.5 percent in fiscal 2001 to 91.7 percent
in fiscal 2002.The following analysis of the components of total
costs and expenses is presented as a percent of sales.
Food and beverage costs decreased in fiscal 2002 primarily
as a result of lower product costs and pricing changes. The com-
parability in fiscal 2001 and 2000 food and beverage costs is pri-
marily a result of pricing changes, favorable menu-mix changes,
and other efficiencies resulting from higher sales volumes in fis-
cal 2001, offset by higher product costs in fiscal 2001.
Restaurant labor decreased in fiscal 2002 and 2001 prima-
rily due to efficiencies resulting from higher sales volumes.
Restaurant expenses include lease, property tax, credit
card, utility, workers’ compensation, new restaurant pre-
opening, and other operating expenses. Restaurant expenses
increased in fiscal 2002 primarily as a result of increased work-
ers’ compensation, credit card, new restaurant pre-opening,
and other operating expenses which were only partially off-
set by lower utility expenses and the impact of higher sales
volumes. Restaurant expenses in fiscal 2001 and 2000 were
comparable, primarily as a result of higher sales volumes in
ManagementÕs Discussion and Analysis
OF FINANCIAL CONDITION AND RESULTS OF OPERATIONS
DARDEN RESTAURANTS
This is the Bottom Line
Great Food and Beverage 18 Produce Great Results in 2002