Qantas 2011 Annual Report Download - page 19
Download and view the complete annual report
Please find page 19 of the 2011 Qantas annual report below. You can navigate through the pages in the report by either clicking on the pages listed below, or by using the keyword search tool below to find specific information within the annual report.-
 1
1 -
2
-
3
-
4
-
5
-
6
-
7
-
8
-
 9
9 -
 10
10 -
 11
11 -
 12
12 -
 13
13 -
 14
14 -
 15
15 -
 16
16 -
 17
17 -
 18
18 -
 19
19 -
 20
20 -
 21
21 -
 22
22 -
 23
23 -
 24
24 -
 25
25 -
 26
26 -
 27
27 -
 28
28 -
 29
29 -
30
-
31
-
32
-
33
-
34
-
35
-
36
-
37
-
38
-
39
-
40
-
41
-
42
-
43
-
44
-
45
-
46
-
47
-
48
-
49
-
50
-
51
-
52
-
53
-
54
-
55
-
56
-
57
-
58
-
59
-
60
-
61
-
62
-
63
-
64
-
65
-
66
-
67
-
68
-
69
-
70
-
71
-
72
-
73
-
74
-
75
-
76
-
77
-
78
-
79
-
80
-
81
-
82
-
83
-
84
-
85
-
86
-
87
-
88
-
89
-
90
-
91
-
92
-
93
-
94
-
95
-
96
-
97
-
98
-
99
-
100
-
101
-
102
-
103
-
104
-
105
-
106
-
107
-
108
-
109
-
110
-
111
-
112
-
113
-
114
-
115
-
116
-
117
-
118
-
119
-
120
-
121
-
122
-
123
-
124
 |
 |
17 ANNUAL REPORT 2011
for the year ended 30 June 2011
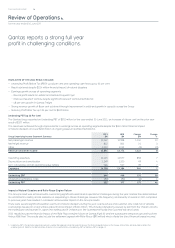
Review of Operations continued
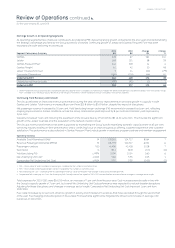
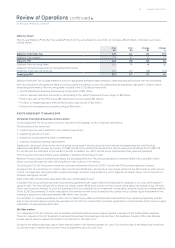
Earnings Growth in All Operating Segments
All operating segments have improved contributions to Underlying PBT, delivering strong growth compared to the prior year and demonstrating
the strategic advantage provided by the Group’s portfolio of brands. Continuing growth of Jetstar and Qantas Frequent Flyer has been
rewarded with both delivering record results.
Segment Performance Summary
$M
$M
Change
$M
Change
%
Qantas
Jetstar
Qantas Frequent Flyer
Qantas Freight
Jetset Travelworld Group () ()
Corporate/Eliminations () () ()
Underlying EBIT
Underlying net nance costs () () ()
Underlying PBT
. Jetset Travelworld Group ceased to be a standalone operating segment from October following its merger with Stella Travel Services and deconsolidation from the Qantas Group.
From October , the equity accounted result of the Group’s investment in Jetset Travelworld Group is included in the Qantas segment.
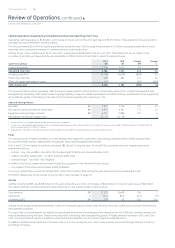
Continuing Yield Recovery and Growth
The Group delivered an improved revenue performance during the year, driven by improvements in yield and growth in capacity in both
Qantas and Jetstar. Total revenue increased per cent from $. billion to $. billion, despite the impact of disruptions.
Net passenger revenue increased by per cent. Yield (excluding foreign exchange (FX) movements) increased by per cent, reecting
ongoing improvement in market conditions across the Group. International yield improved by per cent and Domestic yield improved by
per cent.
Capacity increased per cent following the expansion of the Group’s eet by aircraft to at June . This includes the signicant
growth of the Jetstar business and the acquisition of the Network Aviation Group.
The Group’s revenue performance has been supported by maintaining the Group’s prot maximising domestic capacity share of per cent,
achieving industry leading on-time performance, and a continuing focus on improving product offering, customer experience and customer
satisfaction. This performance is also reected in Qantas Frequent Flyer’s robust growth in members, program partners and member engagement.
Operating Statistics
Available Seat Kilometres (ASKs)M, , ,
Revenue Passenger Kilometres (RPKs)M, , ,
Passenger numbers ‘ , , ,
Seat factor %. . (.) ()
Yield (excluding FX) c/RPK . . .
Net Underlying Unit Costc/ASK . . .
Comparable Net Underlying Unit Costc/ASK . . (.) ()
. ASK – total number of seats available for passengers, multiplied by the number of kilometres own.
. RPK – total number of paying passengers carried, multiplied by the number of kilometres own.
. Net Underlying Unit Cost – Underlying PBT less passenger revenue, fuel and Frequent Flyer change in accounting estimate per ASK.
. Comparable Net Underlying Unit Cost– Net Underlying Unit Cost adjusted for the impact of / natural disasters and adjusted for changes in average sector length.
Total expenses for / were $, million, an increase of per cent from the prior year. Cost increases were broadly in line with
the Group’s capacity growth of per cent, but overall Net Underlying Unit Cost performance was impacted by natural disaster disruptions.
Adjusting for these disruptions and changes in average sector length, Comparable Net Underlying Unit Cost improved per cent from
/.
Fuel costs increased by per cent, driven by growth in activity and increases in fuel prices that have escalated through the second half
of the year. Fuel hedging and participation in favourable FX movements signicantly mitigated the per cent increase in average USD
fuel prices in /.