Qantas 2011 Annual Report Download - page 18
Download and view the complete annual report
Please find page 18 of the 2011 Qantas annual report below. You can navigate through the pages in the report by either clicking on the pages listed below, or by using the keyword search tool below to find specific information within the annual report.-
 1
1 -
2
-
3
-
4
-
5
-
6
-
7
-
 8
8 -
 9
9 -
 10
10 -
 11
11 -
 12
12 -
 13
13 -
 14
14 -
 15
15 -
 16
16 -
 17
17 -
 18
18 -
 19
19 -
 20
20 -
 21
21 -
 22
22 -
 23
23 -
 24
24 -
 25
25 -
 26
26 -
 27
27 -
 28
28 -
29
-
30
-
31
-
32
-
33
-
34
-
35
-
36
-
37
-
38
-
39
-
40
-
41
-
42
-
43
-
44
-
45
-
46
-
47
-
48
-
49
-
50
-
51
-
52
-
53
-
54
-
55
-
56
-
57
-
58
-
59
-
60
-
61
-
62
-
63
-
64
-
65
-
66
-
67
-
68
-
69
-
70
-
71
-
72
-
73
-
74
-
75
-
76
-
77
-
78
-
79
-
80
-
81
-
82
-
83
-
84
-
85
-
86
-
87
-
88
-
89
-
90
-
91
-
92
-
93
-
94
-
95
-
96
-
97
-
98
-
99
-
100
-
101
-
102
-
103
-
104
-
105
-
106
-
107
-
108
-
109
-
110
-
111
-
112
-
113
-
114
-
115
-
116
-
117
-
118
-
119
-
120
-
121
-
122
-
123
-
124
 |
 |

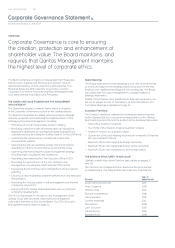
THE QANTAS GROUP 16
for the year ended 30 June 2011
Review of Operations
Qantas reports a strong full year
prot in challenging conditions.
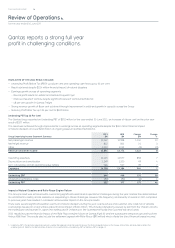
HIGHLIGHTS OF THE RESULT INCLUDE:
— Underlying Prot Before Tax (PBT) up per cent and operating cash ows up by per cent
— Result achieved despite $ million nancial impact of natural disasters
— Earnings growth across all operating segments
– Record prot results for Jetstar and Qantas Frequent Flyer
– Improved results in Qantas, despite signicant losses in Qantas International
– per cent growth in Qantas Freight
— Strong revenue growth of per cent achieved through improvement in yield and growth in capacity across the Group
— Statutory Prot After Tax up per cent to $ million
Underlying PBT Up Per Cent
The Qantas Group reported an Underlying PBT of $ million for the year ended June , an increase of per cent on the prior year
result of $ million.
The result was achieved through improvements in earnings across all operating segments despite the $ million nancial impact
of natural disasters and over $ million of ongoing losses in Qantas International.
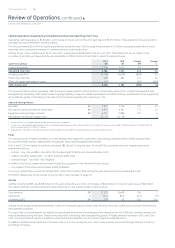
Group Underlying Income Statement Summary
$M
$M
Change
$M
Change
%
Net passenger revenue , , ,
Net freight revenue
Other , , () ()
Revenue and other income , , ,
Operating expenses , ,
Depreciation and amortisation , ,
Non-cancellable aircraft operating lease rentals
Expenses , ,
Underlying EBIT
Underlying net nance costs () () ()
Underlying PBT
Impact of Natural Disasters and Rolls-Royce Engine Failure
The Group’s result was achieved while overcoming signicant external and operational challenges during the year. Qantas has demonstrated
its commitment to safety and its resilience in responding to these challenges. However the frequency and severity of events in compared
to previous years has resulted in a material unfavourable impact on the Group’s results.
There were several signicant weather events and natural disasters during the year. Lost revenues and customer care costs net of variable
cost savings resulted in a total unfavourable nancial impact of $ million. This included disruptions caused by ash from the Chilean volcano,
the earthquake and tsunami in Japan, the earthquake in Christchurch, the Queensland oods and Cyclones Yasi and Carlos.
results include the nancial impact of the Rolls-Royce engine failure on Qantas ight and the subsequent temporary grounding of the
Airbus A eet. The results also include the settlement agreed with Rolls-Royce ($ million) which offsets the direct nancial losses incurred.
. Underlying PBT is the primary reporting measure used by Management and the Board to assess the nancial performance of the Group. All line items are adjusted to reect the
underlying result. Refer to the Statutory Result section for a reconciliation of Underlying PBT to Statutory PBT on page .