Pfizer 2007 Annual Report Download - page 56
Download and view the complete annual report
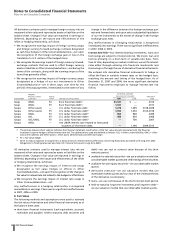
Please find page 56 of the 2007 Pfizer annual report below. You can navigate through the pages in the report by either clicking on the pages listed below, or by using the keyword search tool below to find specific information within the annual report.-
 1
1 -
2
-
3
-
4
-
5
-
6
-
7
-
8
-
9
-
10
-
11
-
12
-
13
-
14
-
15
-
16
-
17
-
18
-
19
-
20
-
21
-
22
-
23
-
24
-
25
-
26
-
27
-
28
-
29
-
30
-
31
-
32
-
33
-
34
-
35
-
36
-
37
-
38
-
39
-
40
-
41
-
42
-
43
-
44
-
45
-
 46
46 -
 47
47 -
 48
48 -
 49
49 -
 50
50 -
 51
51 -
 52
52 -
 53
53 -
 54
54 -
 55
55 -
 56
56 -
 57
57 -
 58
58 -
 59
59 -
 60
60 -
 61
61 -
 62
62 -
 63
63 -
 64
64 -
 65
65 -
 66
66 -
67
-
68
-
69
-
70
-
71
-
72
-
73
-
74
-
75
-
76
-
77
-
78
-
79
-
80
-
81
-
82
-
83
-
84
-
85
 |
 |

54 2007 Financial Report
Notes to Consolidated Financial Statements
Pfizer Inc and Subsidiary Companies
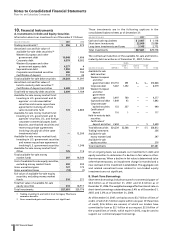
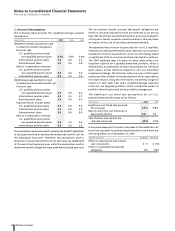
10. Financial Instruments
A. Investments in Debt and Equity Securities
Information about our investments as of December 31 follows:
(MILLIONS OF DOLLARS) 2007 2006
Trading investments(a) $ 256 $ 273
Amortized cost and fair value of
available-for-sale debt securities:(b)
Western European and other
government debt 10,848 1,606
Corporate debt 6,579 8,582
Western European and other
government agency debt 4,277 4
Supranational debt 1,892 460
Corporate asset-backed securities 490 700
Certificates of deposit 117 45
Total available-for-sale debt securities 24,203 11,397
Amortized cost and fair value of
held-to-maturity debt securities:(b)
Certificates of deposit and other 2,609 1,189
Total held-to-maturity debt securities 2,609 1,189
Available-for-sale money market fund:
Investing in U.S. government and its
agencies’ or instrumentalities’
securities and reverse repurchase
agreements involving all of the
same investments held 172 2,885
Available-for-sale money market fund:
Investing in U.S. government and its
agencies’ securities, U.S. and foreign
corporate commercial paper, bank
deposits, asset-backed securities and
reverse repurchase agreements
involving virtually all of the same
investments held —12,300
Available-for-sale money market fund:
Investing in U.S. government securities
and reverse repurchase agreements
involving U.S. government securities —1,246
Available-for-sale money market fund:
Other 125 115
Total available-for-sale money
market funds 297 16,546
Cost of available-for-sale equity securities,
excluding money market funds 202 202
Gross unrealized gains 127 170
Gross unrealized losses (13) (1)
Fair value of available-for-sale equity
securities, excluding money market
funds 316 371
Total fair value of available-for-sale
equity securities 613 16,917
Total investments $27,681 $29,776
(a) Trading investments are held in trust for legacy Pharmacia
severance benefits.
(b) Gross unrealized gains and losses are not significant.
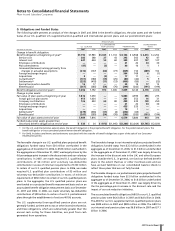
These investments are in the following captions in the
consolidated balance sheets as of December 31:
(MILLIONS OF DOLLARS) 2007 2006
Cash and cash equivalents $ 2,467 $ 1,118
Short-term investments 22,069 25,886
Long-term investments and loans 3,145 2,772
Total investments $27,681 $29,776
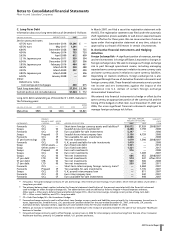
The contractual maturities of the available-for-sale and held-to-
maturity debt securities as of December 31, 2007, follow:
YEARS
_______________________________________________________
OVER 1 OVER 5 OVER
(MILLIONS OF DOLLARS) WITHIN 1 TO 5 TO 10 10 TOTAL
Available-for-sale
debt securities:
Western European
and other
government debt $10,753 $95 $— $— $10,848
Corporate debt 5,287 1,292 — — 6,579
Western European
and other
government
agency debt 3,497 780 — — 4,277
Supranational debt 1,849 43 — — 1,892
Corporate asset-
backed securities 133 357 — — 490
Certificates of
deposit 116 1 — — 117
Held-to-maturity debt
securities:
Certificates of
deposit and other 2,604 — — 5 2,609
Total debt securities $24,239 $2,568 $— $ 5 $26,812
Trading investments 256
Available-for-sale
money market funds 297
Available-for-sale
equity securities 316
Total investments $27,681
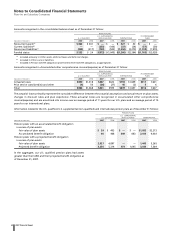
On an ongoing basis, we evaluate our investments in debt and
equity securities to determine if a decline in fair value is other-
than-temporary. When a decline in fair value is determined to be
other-than-temporary, an impairment charge is recorded and a
new cost basis in the investment is established. The aggregate cost
and related unrealized losses related to non-traded equity
investments are not significant.
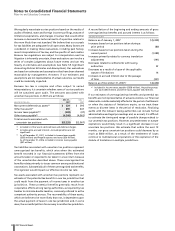
B. Short-Term Borrowings
Short-term borrowings include amounts for commercial paper of
$4.4 billion as of December 31, 2007, and $1.6 billion as of
December 31, 2006. The weighted-average effective interest rate on
short-term borrowings outstanding was 3.4% as of December 31,
2007, and 3.0% as of December 31, 2006.
As of December 31, 2007, we had access to $3.7 billion of lines of
credit, of which $1.5 billion expire within one year. Of these lines
of credit, $3.6 billion are unused, of which our lenders have
committed to loan us $2.1 billion at our request. $2.0 billion of
the unused lines of credit, which expire in 2012, may be used to
support our commercial paper borrowings.