Pfizer 2007 Annual Report Download - page 18
Download and view the complete annual report
Please find page 18 of the 2007 Pfizer annual report below. You can navigate through the pages in the report by either clicking on the pages listed below, or by using the keyword search tool below to find specific information within the annual report.-
 1
1 -
2
-
3
-
4
-
5
-
6
-
7
-
 8
8 -
 9
9 -
 10
10 -
 11
11 -
 12
12 -
 13
13 -
 14
14 -
 15
15 -
 16
16 -
 17
17 -
 18
18 -
 19
19 -
 20
20 -
 21
21 -
 22
22 -
 23
23 -
 24
24 -
 25
25 -
 26
26 -
 27
27 -
 28
28 -
29
-
30
-
31
-
32
-
33
-
34
-
35
-
36
-
37
-
38
-
39
-
40
-
41
-
42
-
43
-
44
-
45
-
46
-
47
-
48
-
49
-
50
-
51
-
52
-
53
-
54
-
55
-
56
-
57
-
58
-
59
-
60
-
61
-
62
-
63
-
64
-
65
-
66
-
67
-
68
-
69
-
70
-
71
-
72
-
73
-
74
-
75
-
76
-
77
-
78
-
79
-
80
-
81
-
82
-
83
-
84
-
85
 |
 |

16 2007 Financial Report
Financial Review
Pfizer Inc and Subsidiary Companies
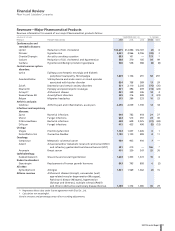
Pharmaceutical Revenues
Our pharmaceutical business is the largest in the world. Revenues
from this segment contributed approximately 92% of our total
revenues in 2007 and 93% of our total revenues in both 2006 and
2005. As of November 2007, seven of our pharmaceutical products
were number one in their respective therapeutic categories based
on revenues.
We recorded product sales of more than $1 billion for each of
eight products in 2007, each of nine products in 2006 and each
of eight products in 2005. These products represented 58% of our
Pharmaceutical revenues in 2007 and 64% of our Pharmaceutical
revenues in both 2006 and 2005.
Worldwide Pharmaceutical revenues in 2007 decreased 1%
compared to 2006, primarily due to:
•a decrease in revenues for Norvasc of $1.9 billion in 2007,
primarily due to the loss of U.S. exclusivity in March 2007;
•a decrease in revenues for Zoloft of $1.6 billion in 2007,
primarily due to the loss of U.S. exclusivity in August 2006;
•a decrease in revenues for Lipitor in the U.S. of $654 million in
2007, primarily resulting from competitive pressures from
generics, among other factors;
•a decrease in revenues for Zithromax of $187 million in 2007,
primarily due to the loss of U.S. exclusivity in November 2005;
and
•the one-time reversal of a sales deduction accrual in 2006
related to a favorable development in a pricing dispute in the
U.S. of about $170 million,
partially offset by:
•an aggregate increase in revenues from products launched in
the U.S. since 2005 of $2.0 billion and from many in-line
products in 2007; and
•the weakening of the U.S. dollar relative to many foreign
currencies, especially the euro, U.K. pound and Canadian dollar,
which increased Pharmaceutical revenues by approximately
$1.3 billion, or 3%, in 2007.
Geographically:
•in the U.S., Pharmaceutical revenues in 2007 decreased 12%
compared to 2006, primarily due to the effect of the loss of
exclusivity on Zoloft and Norvasc, and lower sales of Lipitor,
partially offset by the aggregate increase in revenues from
products launched since 2005 and from many in-line products;
and
•in our international markets, Pharmaceutical revenues in 2007
increased 11% compared to 2006, primarily due to the favorable
impact of foreign exchange on international revenues of
approximately $1.3 billion (6.4%) in 2007, revenues from
products launched since 2005, as well as growth of certain in-
line products.
During 2007, international Pharmaceutical revenues grew to
represent 51.5% of total Pharmaceutical revenues, compared to
45.6% in 2006. This increase has been fueled by higher volumes
and the favorable impact of foreign exchange, despite pricing
pressures in international markets.
Effective January 1, 2008, July 13, 2007, January 1, 2007, and
January 1, 2006, we increased the published prices for certain U.S.
pharmaceutical products. These price increases had no material
effect on wholesaler inventory levels in comparison to the prior year.
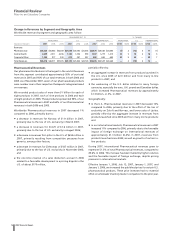
Change in Revenues by Segment and Geographic Area
Worldwide revenues by segment and geographic area follow:
YEAR ENDED DEC. 31, % CHANGE
____________________________________________________________________________________________ _______________________________________________
WORLDWIDE U.S. INTERNATIONAL WORLDWIDE U.S. INTERNATIONAL
___________________________ ___________________________ ___________________________ ______________ ______________ _______________
(MILLIONS OF DOLLARS) 2007 2006 2005 2007 2006 2005 2007 2006 2005 07/06 06/05 07/06 06/05 07/06 06/05
Revenues:
Pharmaceutical $44,424 $45,083 $44,269 $21,548 $24,503 $23,465 $22,876 $20,580 $20,804 (1) 2(12) 411 (1)
Animal Health 2,639 2,311 2,206 1,132 1,032 993 1,507 1,279 1,213 14 510 418 5
Corporate/Other 1,355 977 930 473 287 287 882 690 643 39 565 —28 7
Total Revenues $48,418 $48,371 $47,405 $23,153 $25,822 $24,745 $25,265 $22,549 $22,660 —2(10) 412 —