Pfizer 2007 Annual Report Download - page 32
Download and view the complete annual report
Please find page 32 of the 2007 Pfizer annual report below. You can navigate through the pages in the report by either clicking on the pages listed below, or by using the keyword search tool below to find specific information within the annual report.-
 1
1 -
2
-
3
-
4
-
5
-
6
-
7
-
8
-
9
-
10
-
11
-
12
-
13
-
14
-
15
-
16
-
17
-
18
-
19
-
20
-
21
-
 22
22 -
 23
23 -
 24
24 -
 25
25 -
 26
26 -
 27
27 -
 28
28 -
 29
29 -
 30
30 -
 31
31 -
 32
32 -
 33
33 -
 34
34 -
 35
35 -
 36
36 -
 37
37 -
 38
38 -
 39
39 -
 40
40 -
 41
41 -
 42
42 -
43
-
44
-
45
-
46
-
47
-
48
-
49
-
50
-
51
-
52
-
53
-
54
-
55
-
56
-
57
-
58
-
59
-
60
-
61
-
62
-
63
-
64
-
65
-
66
-
67
-
68
-
69
-
70
-
71
-
72
-
73
-
74
-
75
-
76
-
77
-
78
-
79
-
80
-
81
-
82
-
83
-
84
-
85
 |
 |

30 2007 Financial Report
Financial Review
Pfizer Inc and Subsidiary Companies
Goodwill and Other Intangible Assets
As of December 31, 2007, Goodwill totaled $21.4 billion (19% of
our total assets) and other identifiable intangible assets, net of
accumulated amortization, totaled $20.5 billion (18% of our
total assets).
The components of goodwill and other identifiable intangible
assets, by segment, as of December 31, 2007, follow:
ANIMAL
(MILLIONS OF DOLLARS) PHARMACEUTICAL HEALTH OTHER TOTAL
Goodwill $21,256 $108 $18 $21,382
Finite-lived intangible
assets, net(a) 17,188 322 52 17,562
Indefinite-lived
intangible assets(b) 2,826 109 1 2,936
(a) Includes $16.6 billion related to developed technology rights and
$565 million related to brands.
(b) Includes $2.9 billion related to brands.
Developed Technology Rights — Developed technology rights
represent the amortized value associated with developed
technology, which has been acquired from third parties, and
which can include the right to develop, use, market, sell and/or
offer for sale the product, compounds and intellectual property
that we have acquired with respect to products, compounds
and/or processes that have been completed. We possess a well-
diversified portfolio of hundreds of developed technology rights
across therapeutic categories, primarily representing the amortized
value of the commercialized products included in our
Pharmaceutical segment that we acquired in connection with
our Pharmacia acquisition in 2003. While the Arthritis and Pain
therapeutic category represents about 30% of the total amortized
value of developed technology rights as of December 31, 2007,
the balance of the amortized value is evenly distributed across the
following Pharmaceutical therapeutic product categories:
Ophthalmology; Oncology; Urology; Infectious and Respiratory
Diseases; Endocrine Disorders categories; and, as a group,
Cardiovascular and Metabolic Diseases; Central Nervous System
Disorders and All Other categories. The significant components
include values determined for Celebrex, Detrol/Detrol LA, Xalatan,
Genotropin, Zyvox, and Campto/Camptosar. Also included in this
category are the post-approval milestone payments made under
our alliance agreements for certain Pharmaceutical products,
such as Rebif and Spiriva. These rights are all subject to our
impairment review process explained in the “Accounting Policies:
Long-Lived Assets” section of this Financial Review.
In 2007, we recorded a charge of $1.1 billion for the impairment
of intangible assets (primarily developed technology rights)
associated with Exubera. See the “Our 2007 Performance: Decision
to Exit Exubera” section of this Financial Review.
Brands — Significant components of brands include values
determined for Depo-Provera contraceptive, Xanax and Medrol.
In 2006, we recorded impairment charges of approximately $320
million related to the Depo-Provera brand (see Notes to
Consolidated Financial Statements—Note 7. Other (Income)/
Deductions—Net).
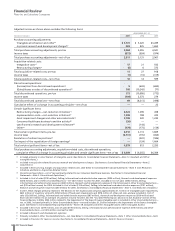
Selected Measures of Liquidity and Capital Resources
The following table sets forth certain relevant measures of our
liquidity and capital resources as of December 31:
AS OF DECEMBER 31,
__________________________________
(MILLIONS OF DOLLARS, EXCEPT RATIOS AND PER COMMON
SHARE DATA) 2007 2006
Cash and cash equivalents and
short-term investments and loans $26,092 $28,227
Working capital(a) $25,014 $25,559
Ratio of current assets to
current liabilities 2.15:1 2.16:1
Shareholders’ equity per common
share(b) $ 9.65 $ 10.05
(a) Working capital includes assets held for sale of $114 million as of
December 31, 2007, and $62 million as of December 31, 2006.
Working capital also includes liabilities held for sale of nil as of
December 31, 2007, and $2 million as of December 31, 2006.
(b) Represents total shareholders’ equity divided by the actual
number of common shares outstanding (which excludes treasury
shares and those held by our employee benefit trust).
Working capital and the ratio of current assets to current liabilities
in 2007 were comparable to 2006, primarily due to:
•inventory write-offs ($661 million) related to Exubera (See the
“Our 2007 Performance: Decision to Exit Exubera” section of
this Financial Review), as well as liabilities of $375 million
accrued in connection with this decision;
•an increase in Other current liabilities related to our cost-
reduction initiatives of $702 million; and
•the funding of share purchases, dividends and capital
expenditures in part through the use of the proceeds from the
redemption of short-term investments and the use of short-term
borrowings,
offset by:
•the reclassification to noncurrent of certain amounts associated
with uncertain tax positions of about $3.6 billion ($4.0 billion
upon adoption on January 1, 2007, of a new accounting standard,
partially offset by $0.4 billion of activity in 2007).
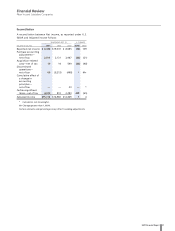
Summary of Cash Flows
YEAR ENDED DEC. 31,
_________________________________________________
(MILLIONS OF DOLLARS) 2007 2006 2005
Cash provided by/(used in):
Operating activities $ 13,353 $ 17,594 $14,733
Investing activities 795 5,101 (5,072)
Financing activities (12,610) (23,100) (9,222)
Effect of exchange-rate
changes on cash and cash
equivalents 41 (15) —
Net increase/(decrease) in cash
and cash equivalents $ 1,579 $ (420) $ 439